
Figure 6.
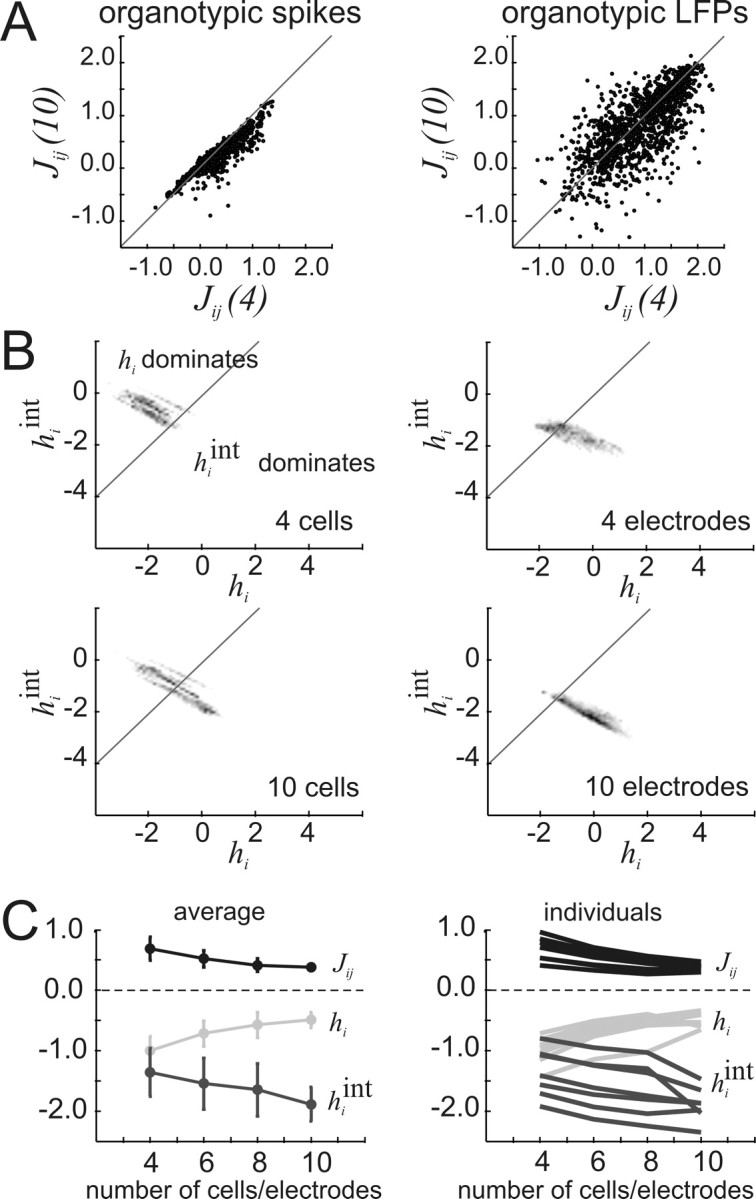
Interactions, Jij, and local fields, hi, change with ensemble size. A, Left, Interaction strengths for cell pairs chosen from a 10-cell ensemble, Jij(10), plotted against interaction strengths for the same cell pairs chosen from a 4-cell ensemble, Jij(4), for representative organotypic spike data. Right, Same plot now with representative organotypic LFP data. Note that asymmetry in spike plot is not present in LFP plot, indicating that in this case interaction strength decreases with ensemble size more for spikes than for LFPs. B, Plots of local field strength caused by interactions, hiint, against local field strength caused by intrinsic activity, hi. Density cloud moves across the diagonal line as ensemble size is increased from four to 10, indicating that hiint dominates over hi in larger ensembles. Higher density is coded by darker pixels. C, Left, Average of Jij(10), hi, and hiint for all preparations as ensemble size is increased. Significant changes with ensemble size occurred for Jij (F = 5.91, Fcrit = 2.85, α = 0.05, df = 3, 39) and hi (F = 7.65), but not for hiint (F = 2.54). Right, Individual plots of Jij(10), hi, and hiint for each preparation as ensemble size is increased, showing that average trends were followed in each individual case. Error bars give SDs. Results shown are for data binned at 20 ms. Full results are given in Tables 2 and 3.