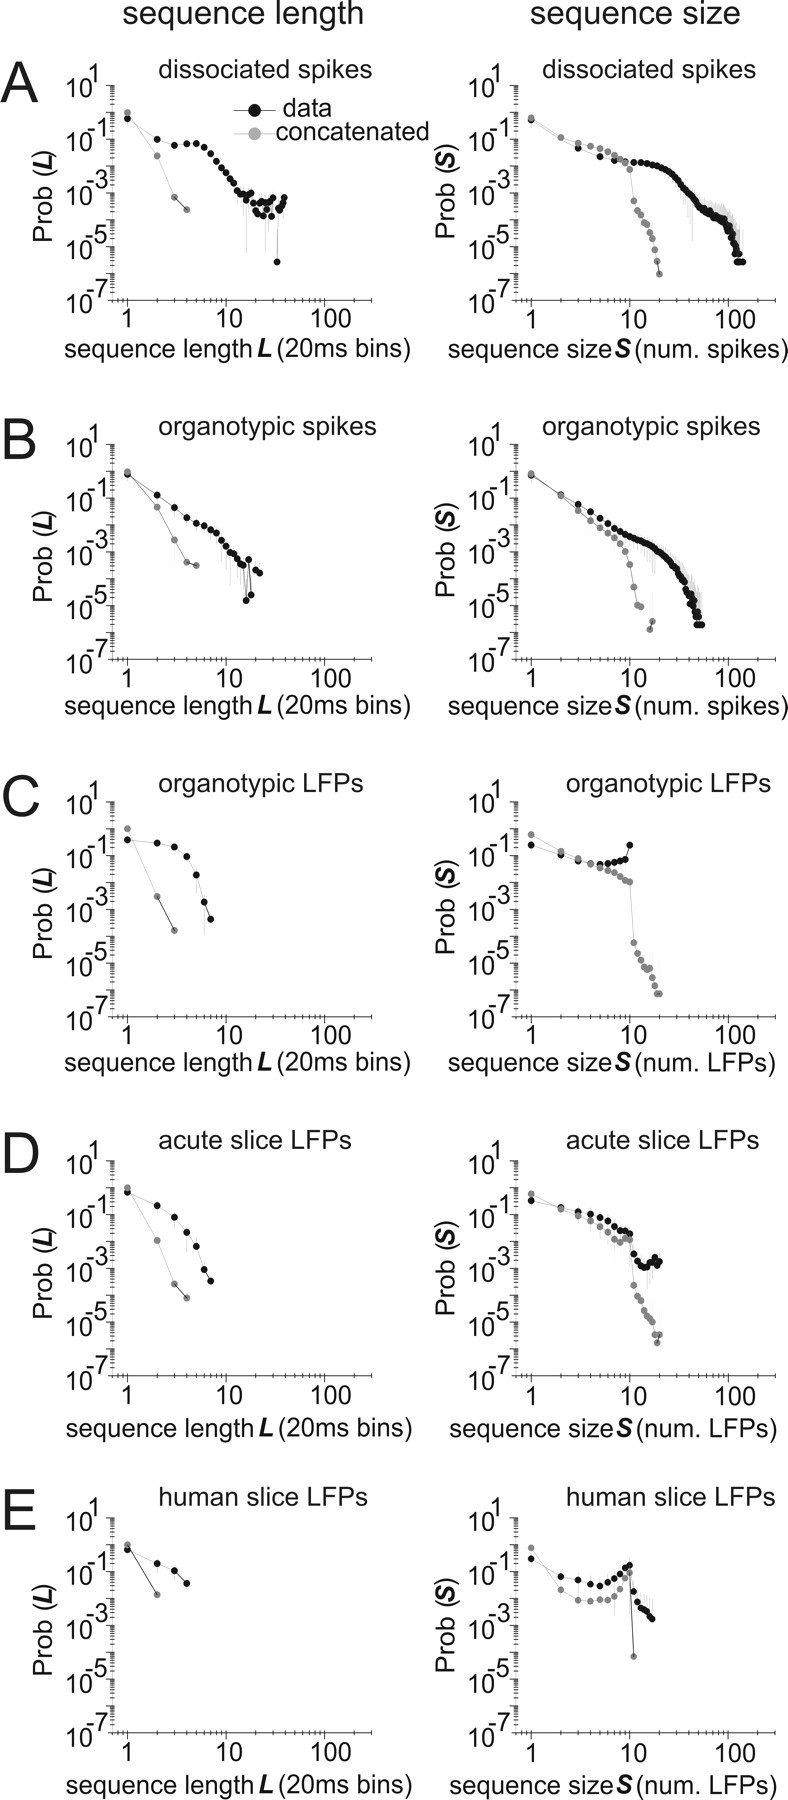
Figure 8.

Sequence lengths and sizes predicted by concatenation are often significantly smaller than those found in actual data. Concatenated sequences were constructed by randomly drawing states from the model probability distribution. The left column shows sequence length distributions for concatenated sequences (gray) and data (black); the right column shows sequence size distributions. A–E show representative plots for data from dissociated spikes, organotypic spikes, organotypic LFPs, acute slice LFPs, and human slice LFPs. Error bars show SDs. Results shown are for data binned at 20 ms.
