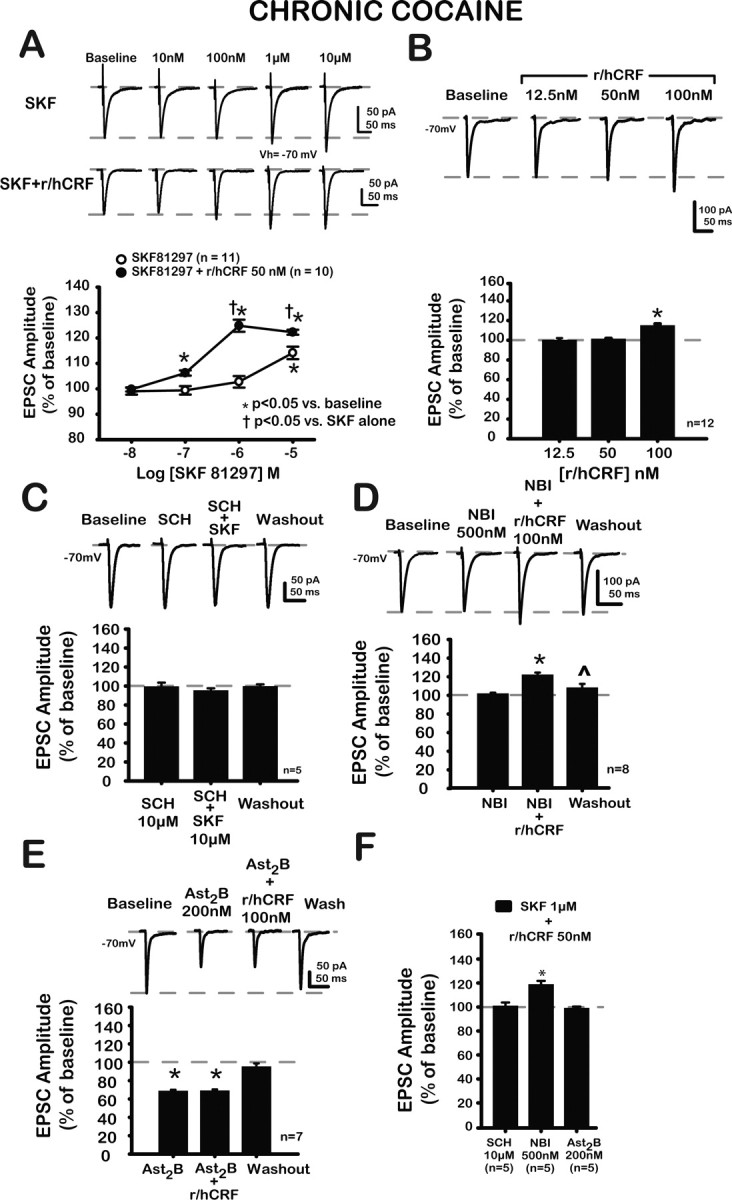
Figure 6.

Actions of SKF alone, in combination with r/hCRF, with r/hCRF alone, and with antagonists were altered after chronic cocaine administration. A, Representative traces of EPSCs at baseline, after increasing concentrations of SKF (top traces), and SKF plus r/hCRF (50 nm; bottom traces). Bottom, Concentration–response curves for each treatment group. SKF (10 μm) significantly increased EPSCs (114.1 ± 2.5%). Lower concentrations of SKF did not affect EPSCs, indicating that r/hCRF (50 nm) synergistically enhanced SKF effects. B, Representative traces of EPSCs at baseline and after r/hCRF (12.5, 50, 100 nm). R/hCRF (100 nm) significantly increased EPSC amplitude (115.0 ± 1.2%; p < 0.01). Lower concentrations of r/hCRF (12.5, 50 nm) did not have a significant effect on EPSC amplitude (12.5 nm, 99.3 ± 1.3%; p > 0.05; 100.9 ± 1.1%; p > 0.05). C, Representative traces of EPSCs at baseline, after SCH (10 μm), after SCH (10 μm) plus SKF (10 μm), and after 20 min washout. Summary data are shown in bar graph below. SCH (10 μm) did not have a significant effect on EPSCs (99.4 ± 4.2%; p > 0.05). SCH (10 μm) blocked the effects of SKF (10 μm, 95.3 ± 2.4% after SCH plus SKF; p > 0.05; 99.6 ± 2.0% after washout; p > 0.05). D, Representative traces of EPSCs at baseline after NBI (500 nm), after r/hCRF (100 nm) plus NBI (500 nm), and after 20 min washout. Summary data are shown in bar graph below. NBI (500 nm) did not affect EPSCs (101.9 ± 0.9%; paired t = −2.02; p > 0.05), and NBI (500 nm) did not block the effects of r/hCRF (100 nm; r/hCRF effect, F(3,21) = 58.99; p < 0.01) on EPSCs (122.1 ± 1.7% after 500 nm NBI plus 100 nm r/hCRF; p < 0.01; 108.3 ± 2.3% after washout; p > 0.05). E, Representative traces of EPSCs at baseline, after Ast2B (200 nm), after r/hCRF (100 nm) plus Ast2B, and after 20 min washout. Summary data are illustrated in bar graph below. Ast2B itself depressed EPSCs (68.8 ± 1.2%; Ast2B effect, F(3,18) = 144.4; p < 0.01) and blocked r/hCRF (100 nm) effects on EPSCs (Ast2B plus r/hCRF, 69.1 ± 0.1%; p > 0.05 compared with Ast2B alone). F, Bar graph summarizes the effects of selective antagonists for D1/5 (SCH, 10 μm), CRF1 (NBI, 500 nm), and CRF2 (Ast2B, 200 nm) receptors on the effects of combined agonists. Ast2B and SCH blocked the effects of the combined agonists on EPSCs (SCH plus r/hCRF plus SKF, 100.8 ± 2.7%; paired t = 0.30; p > 0.05; Ast2B plus r/hCRF plus SKF, 98.9 ± 1.3%; paired t = 0.85; p > 0.05). NBI (500 nm) was unable to block the effects of the combined agonists (118.5 ± 2.9%; p < 0.05 compared with baseline; t = 1.6; p > 0.05 compared with SKF plus r/hCRF). *p < 0.05 versus baseline.
