
Figure 4.
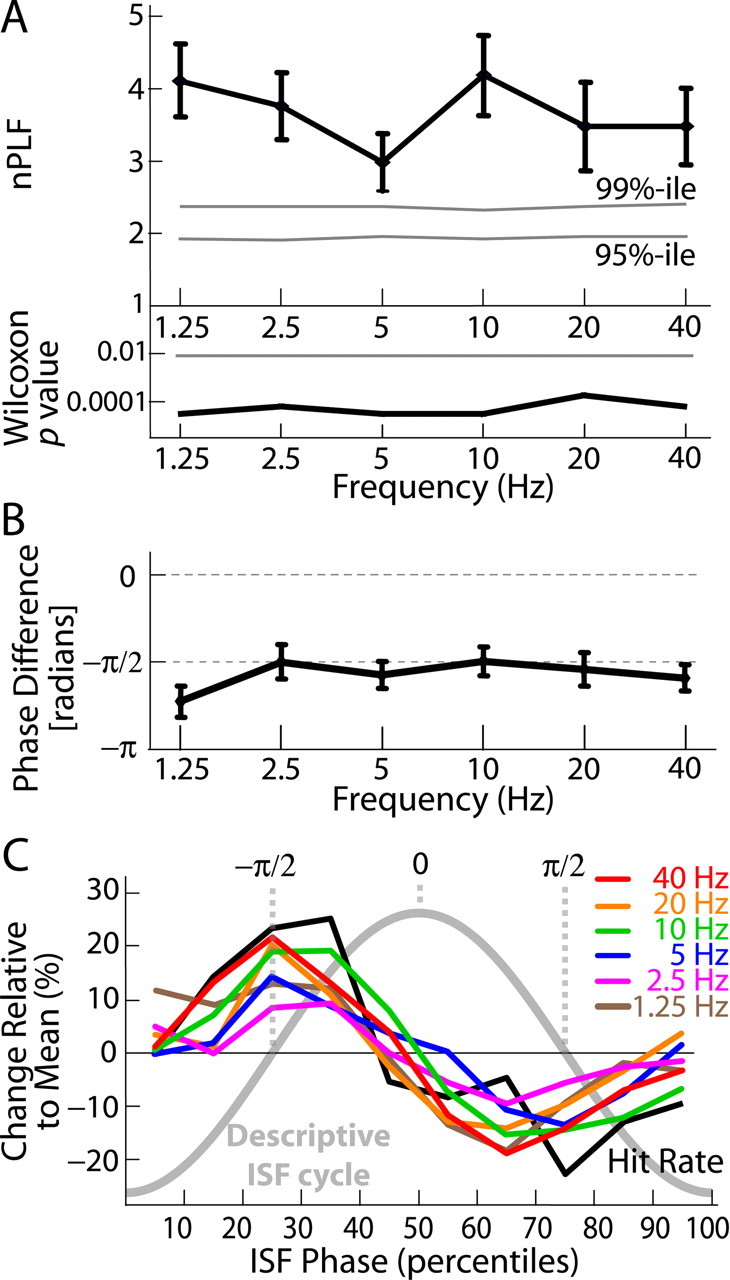
EEG oscillations (1–40 Hz) are nested in ISF. A, The amplitude envelopes of six frequency bands from 1.25 to 40 Hz are synchronized with the ISF (top). The normalized phase-locking factors (nPLF ± SEM; black) are well above the distribution of surrogate data (mean = 1; gray lines indicate the 95th and 99th percentiles of surrogates). The statistical significance of nPLFs was estimated with the paired Wilcoxon signed-rank test (bottom). The horizontal line indicates Bonferroni-corrected p = 0.05 (n = 6). B, The phase difference (mean ± SEM) between the amplitude envelope of the faster oscillations and the ISF is consistently at approximately −π/2. C, The correlation of 1–40 Hz oscillation amplitudes (colored lines) with the ISF phase is similar to that of the behavioral data (black line) (compare with Fig. 3A). The ISF phase ranges from −π to π in bins of 10 percentiles. The thick gray line denotes a descriptive ISF cycle.