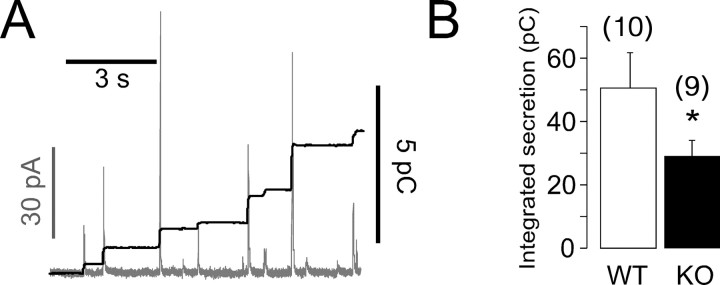
Figure 3.
Secretory responses of CgA-KO chromaffin cells studied with amperometry. A, Representative trace (gray) showing the amperometric recording from an isolated cell stimulated for 5 s with 5 mm BaCl2. Each spike represents the CA released from a single vesicle. The black outline shows the cumulative secretory response obtained by integration of the amperometric charge after baseline subtraction. B, Total secretion (mean ± SEM) comparing WT with CgA-KO cells; the cumulative charges were measured for 2 min after the stimulus and expressed in picocoulombs. The number of cells from each group is expressed in parentheses. *p < 0.05, Student's t test.

