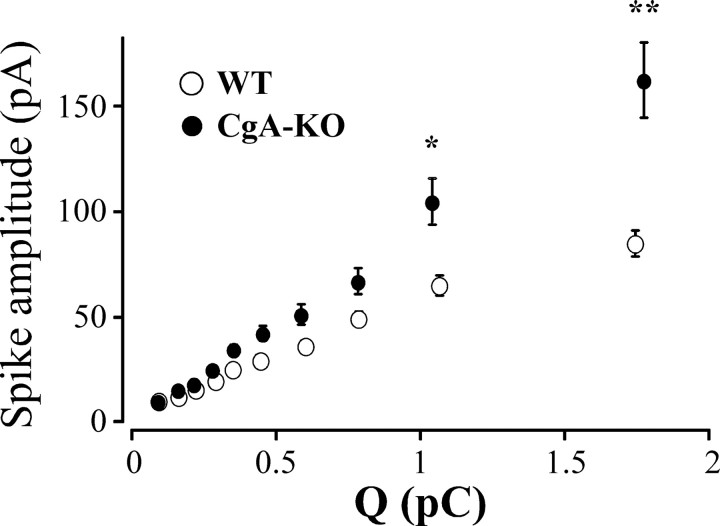
Figure 5.
Spike amplitude versus quantal size of secretory spikes from CgA-KO and WT mice. All spikes (from WT and CgA-KO) were pooled regardless of whether they were from WT or KO cells and then distributed into 10 intervals of increasing charge containing the same number of spikes. The spikes were then split into WT and KO and their I max (mean ± SEM) analyzed. Note that, at similar quantal size, the spikes from CgA-KO have a larger I max than WT. *p < 0.005; **p < 0.001, Mann–Whitney U test with Bonferroni correction. Data are averaged from the spikes accounted in Table 1.

