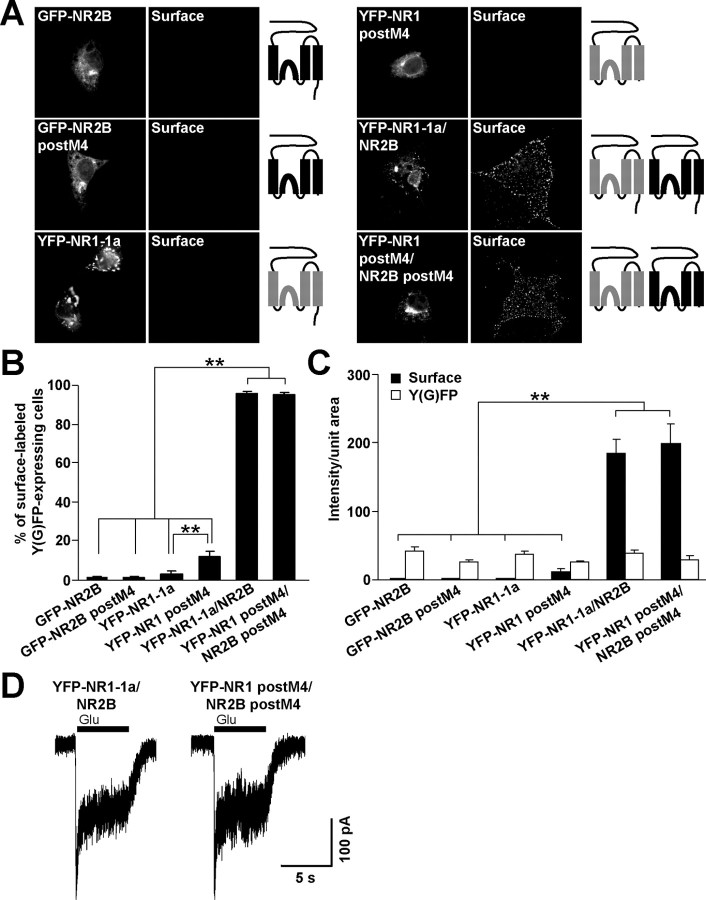
Figure 1.
NR2B and NR1 subunits truncated after M4 are localized intracellularly. A, COS7 cells transfected with indicated cDNAs were surface stained with rabbit anti-GFP antibodies. Schematic diagrams show the structure of NR2B (black) and NR1 (gray) subunits. B, The percentages of cells having surface staining were determined for >300 Y(G)FP-expressing cells for each combination of NMDA receptor subunits in three experiments. The bar graphs represent mean ± SEM. **p < 0.001, ANOVA. C, Data represent mean ± SEM of fluorescence intensities per unit area obtained for surface (black) or total Y(G)FP (white) expression. More than 45 Y(G)FP-expressing cells for each combination of cDNAs were analyzed in three experiments. **p < 0.001, ANOVA. D, Whole-cell patch-clamp recordings were performed from HEK293 cells cotransfected with YFP-NR1-1a/NR2B or YFP-NR1 postM4/NR2B postM4. Representative traces for both combinations are shown. Currents were elicited with 5 s applications of 1 mm glutamate and 1 mm glycine (indicated by filled bar). Quantitative analysis of the NMDA receptor mediated currents revealed that the mean peak current amplitudes were not significantly different between YFP-NR1-1a/NR2B and YFP-NR1 postM4/NR2B postM4; n = 8; p > 0.05, unpaired t test.

