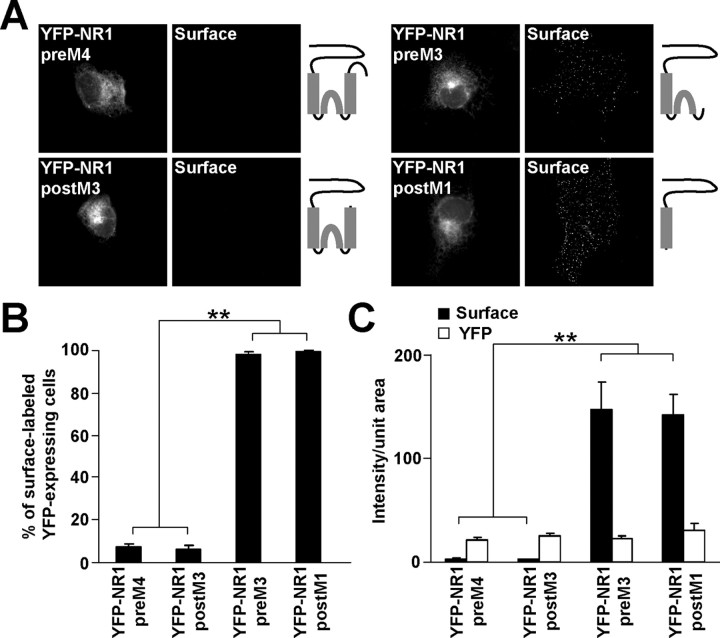
Figure 3.
NR1 M3 contains an ER retention signal. A, Live COS7 cells expressing YFP-NR1 truncations were labeled with polyclonal anti-GFP antibodies. Schematic diagrams show the structure of YFP-NR1 truncations. B, The percentages of surface labeled cells were determined for >300 YFP-positive cells for each construct in three experiments. Data represent mean ± SEM. C, Surface (black) and total (white) expression of YFP-NR1 truncations is shown. Data represent mean ± SEM of fluorescence intensities per unit area obtained from at least 45 YFP-expressing cells for each construct in three experiments. **p < 0.001, ANOVA.

