
Figure 7.
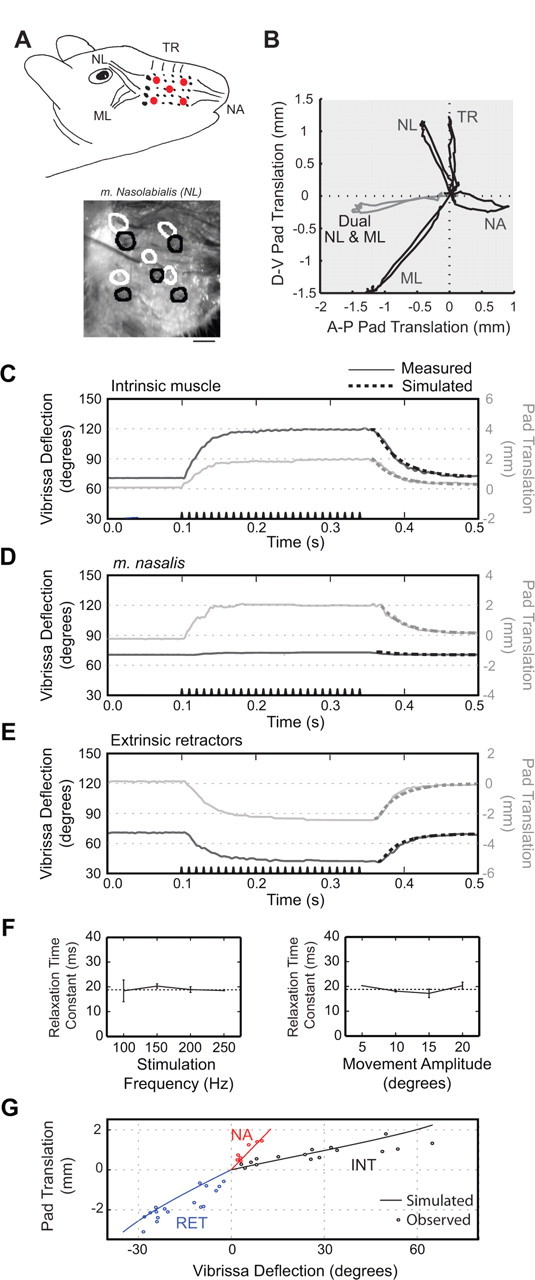
Trajectories of movement elicited by current stimulation of facial muscles in an anesthetized rat. Motion is typical of results obtained from four rats. A, Top, Diagram of extrinsic muscles indicating location of markers on pad (red dots). NL, m. nasolabialis; ML, m. maxillolabialis; NA, m. nasalis; TR, m. transversus nasi. Bottom, Image of mystacial pad with circles indicating location of the markers before stimulation (black) and during (white). B, Pad motion during muscle stimulation. Each trace represents the path of the central marker on the mystacial pad during extrinsic muscle stimulation. Dual stimulation of m. nasolabialis and m. maxillolabialis in gray demonstrates the reduced D-V translation of the pad during simultaneous contraction of these muscles. C–E, A-P vibrissa deflection and pad translation during muscle stimulation. The stimulus train is shown along the time axis. The dashed curve at the offset of stimulation is the estimated relaxation time course from the biomechanical model. F, Relaxation time constant as a function of stimulus parameters. Both panels are from data obtained from intrinsic muscle stimulation in a single rat. Error bars are 1 SE. Lack of error bar indicates only one data point was obtained. For movement amplitudes, trials were binned at the indicated value ±5°. G, Pad translation versus vibrissa deflection at peak movement during stimulus. Points represent all trials across three rats. Solid lines are estimated pad translation and vibrissa deflection from biomechanical model when only the indicated muscle is active.