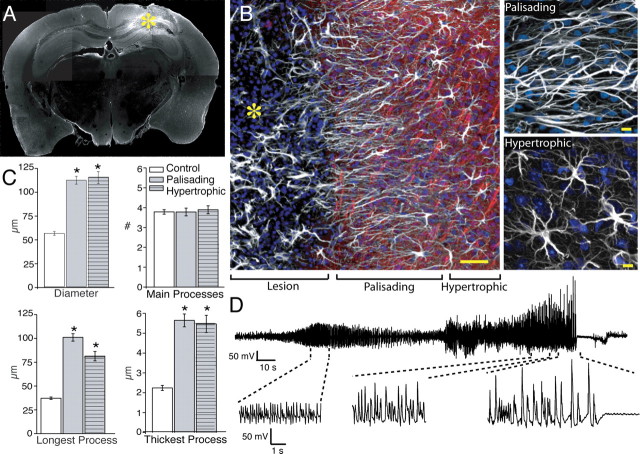
Figure 2.
Structure and organization of reactive astrocytes 1 week after injury. A, Cortical slice immunolabeled for GFAP 1 week after iron injection. A marked upregulation of GFAP (white) is evident around the lesion. The yellow asterisk indicates the lesion site. B, High-power image of the border of the injury site. Astrocytes directly adjacent to the lesion extend long processes oriented toward the lesion site (palisading astrocytes; 0–200 μm). Astrocytes located at a greater distance from the lesion (200–1000 μm) also exhibited reactive changes, but their processes were not oriented toward the injury site (hypertrophic astrocytes). White, GFAP; red, Map2; blue, Sytox. Scale bar (SB), 50 μm. Top right, Palisading astrocytes next to area of injury. SB, 10 μm. Bottom right, Hypertrophic astrocytes. SB, 10 μm. C, Morphometric analysis of diameter, number of main processes, and longest and thickest process based on GFAP (control, n = 65 cells, 6 mice; 1 week after injury, n = 65 cells, 7 mice; mean ± SEM; *p < 0.001). D, Representative EEG recording 2 d after injury.

