Figure 4.

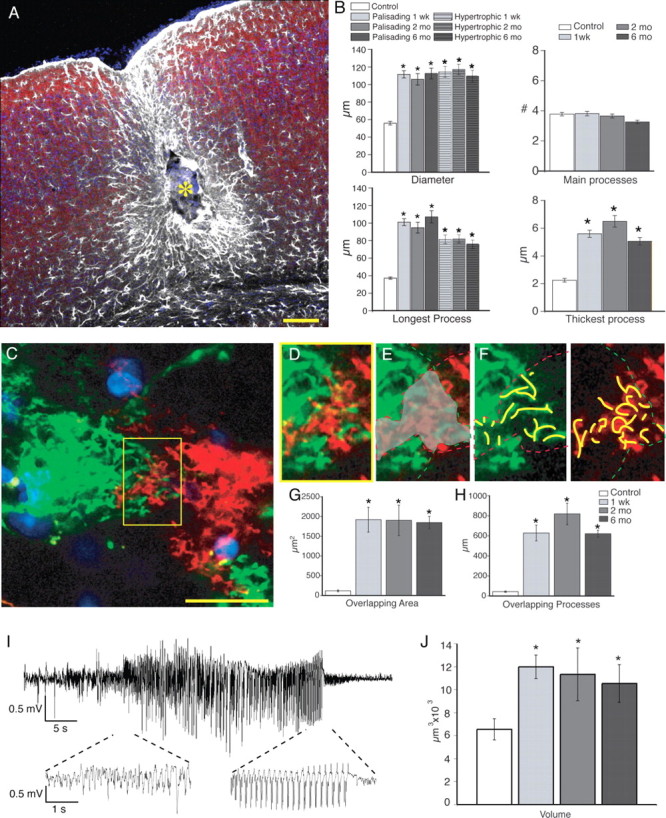
Structure and organization of reactive astrocytes 2 and 6 months after injury. A, Site of injury 6 months after injection of iron. The center of the lesion (yellow asterisk) is surrounded by palisading astrocytes and, at a greater distance, by hypertrophic astrocytes. White, GFAP; red, Map2; blue, Sytox. Scale bar (SB), 100 μm. B, Morphometric analysis of diameter, number of main processes, and longest and thickest process based on GFAP (2 months after iron injection, n = 50 cells, 3 mice; 6 months, n = 65 cells, 5 mice; mean ± SEM; *p < 0.001). The diameter, maximum length of process, and maximum thickness of GFAP-positive processes were significantly increased at both 2 and 6 months after injury compared with control. C, Diolistic labeling of cortical astrocytes near the area of injury, 6 months after injection. SB, 20 μm. D–F, High-power image of yellow box in C. E, Gray area delineates area of overlap between the adjacent cells. F, Yellow lines represent overlapping processes into the adjacent cell's domain. G, H, Quantification of overlapping area and summation of lengths of overlapping processes for 1 week and 2 and 6 months after injury. Area of overlap at 1 week and 2 and 6 months after injection was significantly increased compared with control (2 months, n = 18 cells, 3 mice; 6 months, n = 18 cells, 6 mice; mean ± SEM; *p < 0.001). I, Representative EEG trace recorded 6 months after iron injection. J, Quantification of the volume of reactive astrocytes 1 week and 2 and 6 months after iron injection compared with control (2 months, n = 7 cells, 3 mice; 6 months, n = 7 cells, 4 mice; mean ± SEM; *p < 0.05).
