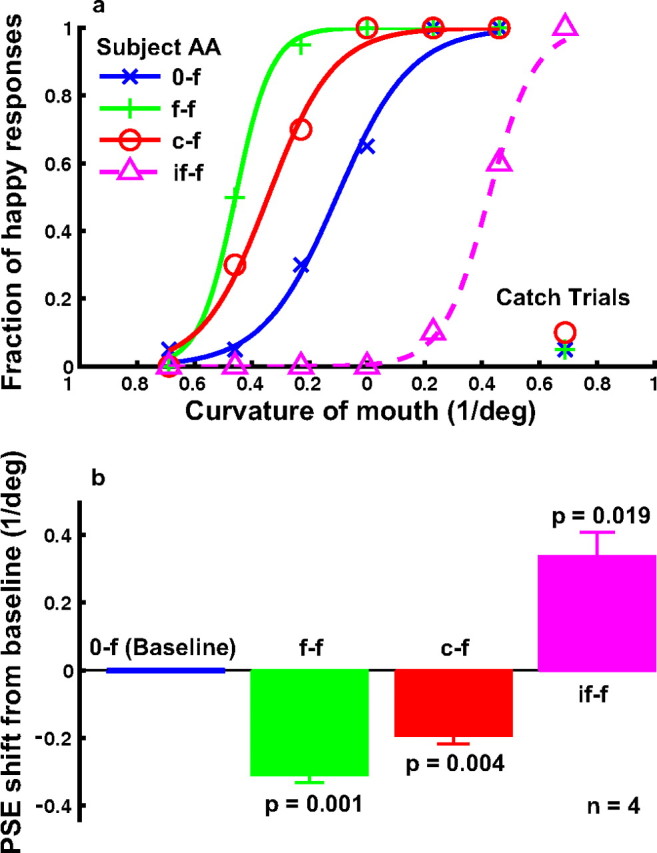
Figure 3.

The effect of curve adaptation on the perceived expression of the cartoon faces (experiment 1). a, Psychometric functions from a naive subject under the following conditions. 0-f, No adaptation baseline (blue); f-f, adaptation to the saddest face (green); c-f, adaptation to the most concave curve, which was identical to the mouth of the saddest face (red); if-f, adaptation to the inverted saddest face (magenta dashed). For each condition, the fraction of happy responses was plotted as a function of the mouth curvature of the test faces. The catch-trial results for the 0-f, f-f, and c-f conditions are also shown. b, Summary of all four subjects' data. For each condition, the average PSE relative to the baseline condition and the SEM were plotted. The p value shown for each condition in the figure was calculated against the baseline condition using the two-tailed paired t test.
