
Figure 6.
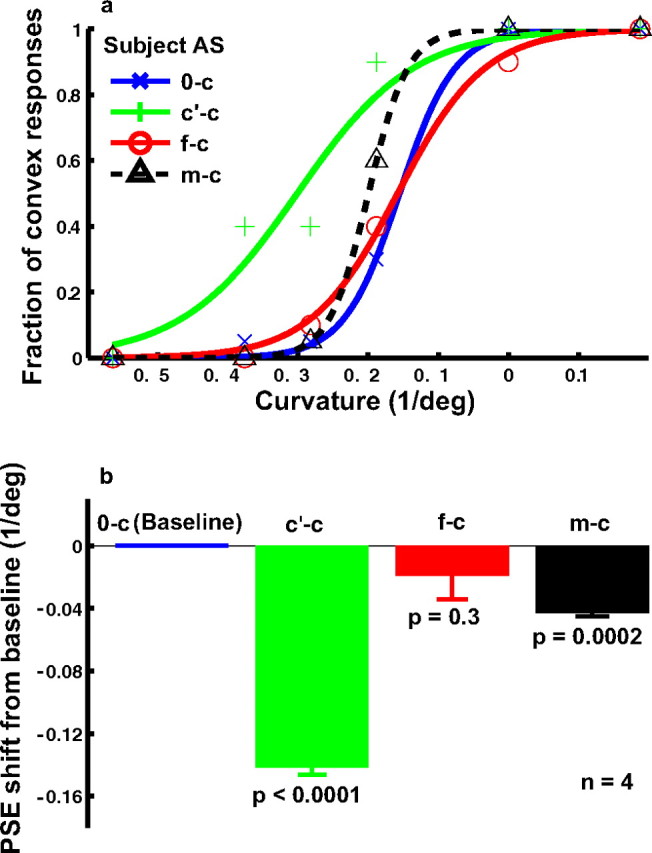
The (null) effect of real-face adaptation on curvature judgment (experiment 2). a, Psychometric functions from a naive subject under the following conditions. 0-c, No adaptation baseline (blue); c′-c, adaptation to the concave curve, whose curvature, length, and contrast matched those of the saddest face (green); f-c, adaptation to the saddest face (red); m-c, adaptation to the mouth isolated from the saddest face (black). For each condition, the fraction of convex responses was plotted as a function of the curvature of the test curves. b, Summary of all four subjects' data. For each condition, the average PSE relative to the baseline condition and the SEM were plotted. The p value shown for each condition in the figure was calculated against the baseline condition using the two-tailed paired t test. Unlike the corresponding cartoon-face result in Figure 4, the f-c condition did not generate a significant shift of the PSE from the baseline.