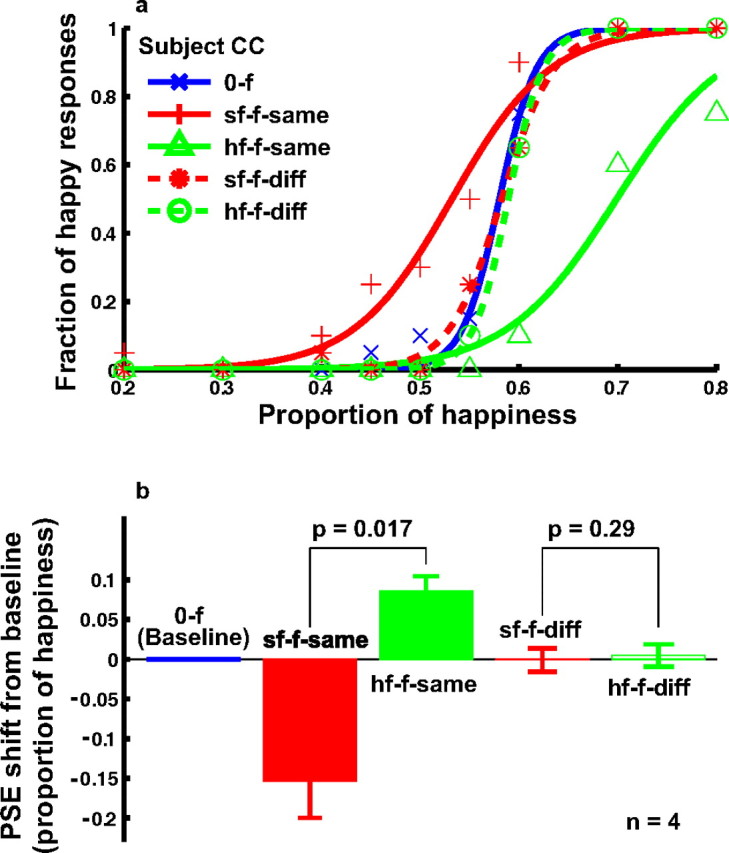
Figure 8.

Positional specificity of the facial-expression aftereffect after adaptation to real faces from the MMI face set (experiment 4). a, Psychometric functions from a naive subject under the following conditions. 0-f, No adaptation baseline (blue); sf-f-same, adaptation to the saddest face placed at the same location as the test faces (red solid); hf-f-same, adaptation to the happiest face placed at the same location as the test faces (green solid); sf-f-diff, adaptation to the saddest face, whose top edge was 0.2° below the bottom edge of the test faces (red dashed); hf-f-diff, adaptation to the happiest face, whose top edge was 0.2° below the bottom edge of the test faces (green dashed). b, Summary of all four subjects' data. The sf-f-same and hf-f-same conditions were compared, and the sf-f-diff and hf-f-diff conditions were compared, using the two-tailed paired t test.
