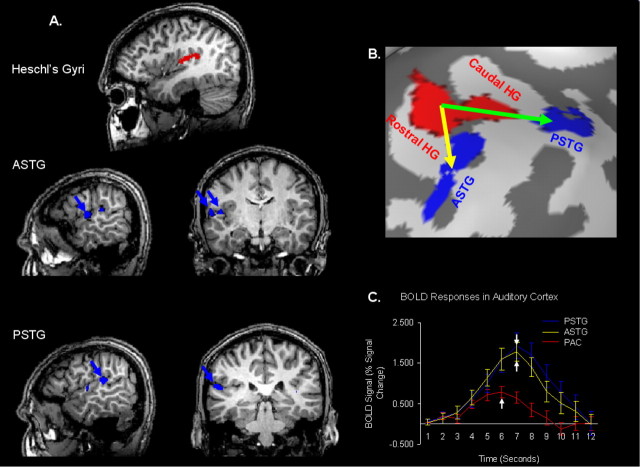
Figure 3.
Effective connectivity in auditory cortex II. A, Effective connectivity maps are shown for a subject with a rostral and caudal Heschl's gyrus. In the top row, the rostral and caudal Heschl's gyri are marked in red. On the left side, the rostrolateral and caudolateral clusters identified by GCM analysis are shown on T1-weighted sagittal slices, whereas on the right these maps are shown in the coronal view. B, Effective connectivity maps are shown on the inflated brain surface. Functional connectivity was observed between rostral and caudal Heschl's gyri. The green arrow depicts a caudal pathway as defined by GCM analysis, whereas the yellow arrow represents a possible rostral pathway. C, The averaged BOLD response time courses for the PAC and rostrolateral and caudolateral clusters are shown. White arrows indicate temporal points at which the peak in the BOLD response occurred in each of the three time course. All single-subject (n = 8) effective connectivity maps are shown in supplemental Figure 3 (available at www.jneurosci.org as supplemental material).

