
Figure 3.
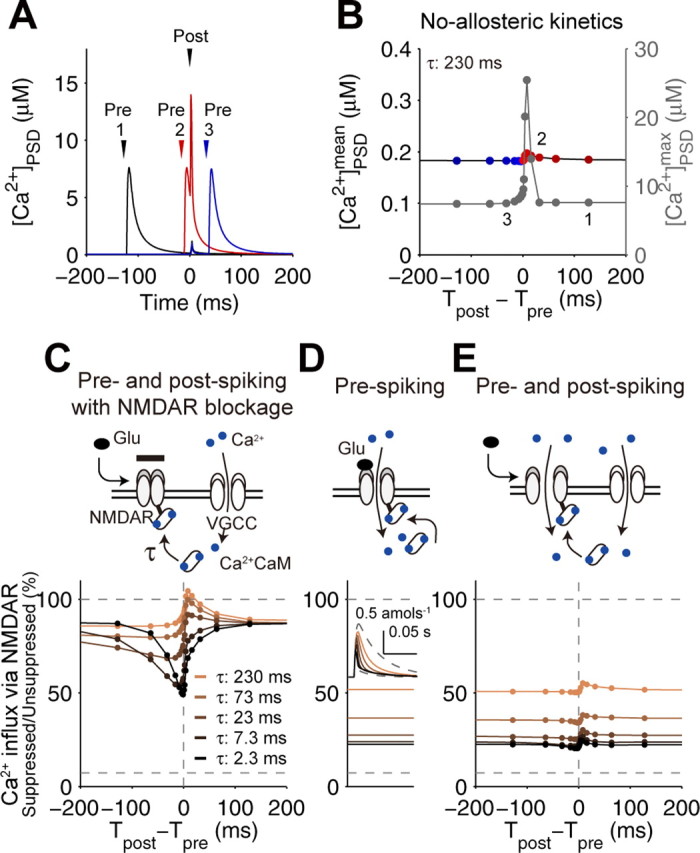
Requirement of the distinct suppression of NMDARs. A, Time courses of spike timing-dependent [Ca2+]PSD by a single pairing of prespiking and postspiking in the STDP model (the no-allosteric model) with the indicated spike timing in B; 1, prespiking → postspiking (Tpost − Tpre = +128 ms; black); 2, prespiking → postspiking (+16 ms; red); 3, postspiking → prespiking (−32 ms; blue). B, Spike timing-dependent Ca2+ increase in the no-allosteric model. The mean and maximum [Ca2+]PSD are indicated by black and gray, respectively. The mean denotes the integration of Ca2+ induced by a single pairing of prespiking and postspiking divided by 1 s. Tpost was defined as the time of 5 ms after the onset of current injection represented by an α-function (500 pA, 0.5 ms), and Tpre was defined as the time of the onset of glutamate release. The positive (red) and negative (blue) intervals correspond to the prespike → postspike and postspike → prespike timing, respectively. C, Spike timing-dependent suppression of NMDARs under the blockage of Ca2+ influx via NMDARs. Expected Ca2+ influx, if the NMDARs open, are plotted with the indicated time constant of Ca2+ · CaM binding to NMDARs, τ. Ca2+ influx via NMDARs was normalized by unsuppressed Ca2+ influx (C–E). D, Ca2+ influx via NMDARs induced by a prespiking alone with the indicated τ. The inset shows the time courses of the total NMDAR-mediated Ca2+ influx. E, Spike timing-dependent Ca2+ influx via NMDARs.