
Figure 6.
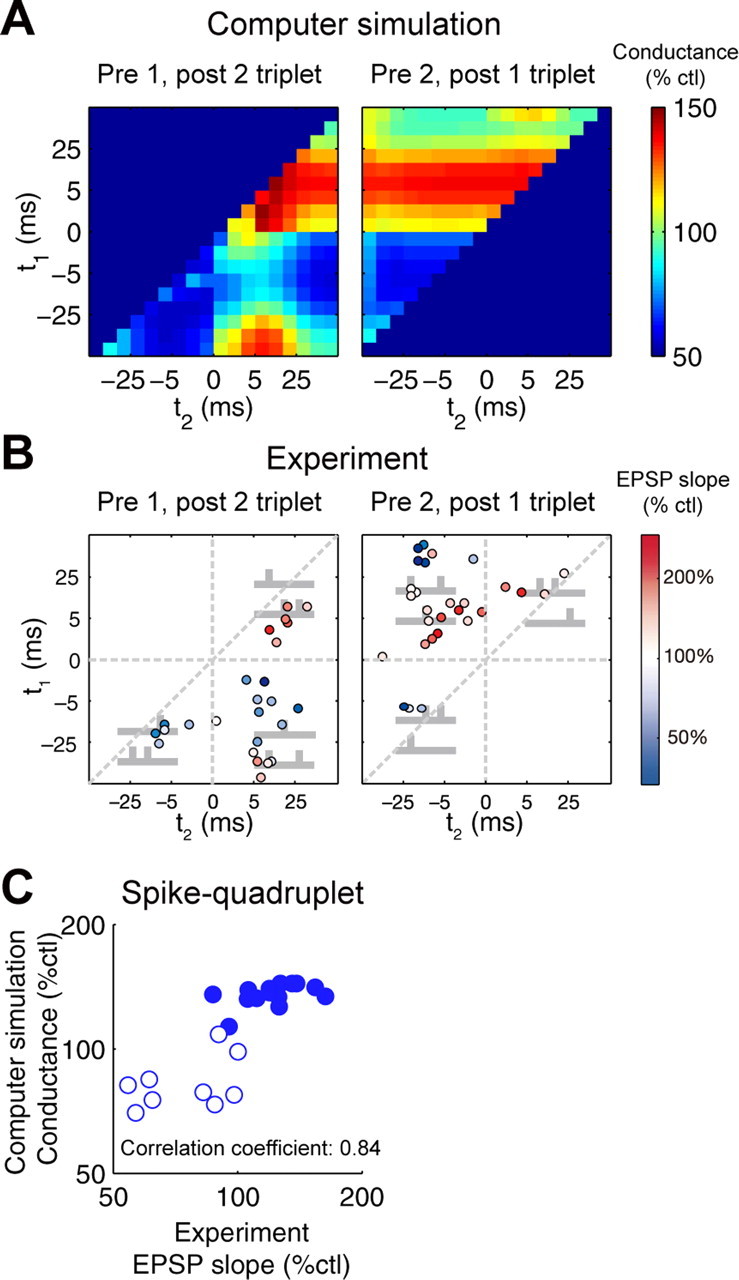
Complex spike timing-dependent synaptic plasticity. A, B, Changes of synaptic strength by spike triplets in the allosteric model (A) and in the experiments (B) (Froemke and Dan, 2002) (reproduced with permission from Nature). One prespiking and two postspiking (left), where t1 indicates the relative timing of the first postspiking to prespiking (Tpost 1 − Tpre), and t2 indicates the relative timing of the second postspiking to prespiking (Tpost 2 − Tpre). Two prespiking and one postspiking (right), where t1 = Tpost − Tpre 1 (Tpre 1, first prespiking) and t2 = Tpost − Tpre 2 (Tpre 2, second prespiking). Data in A were taken at 2 min after onsets of stimulation and averaged across three trials with different profiles of glutamate release based on presynaptic short-term depression (SEM <0.26%). C, Changes of synaptic strength by spike quadruplets. Synaptic conductance in the allosteric model versus correspondence in the experiments was plotted (Froemke et al., 2005). Open symbols, Prespiking → postspiking → postspiking → prespiking; filled symbols, postspiking → prespiking → prespiking → postspiking. Simulation data were averaged across three trials (SEM <0.38%).