
Figure 2.
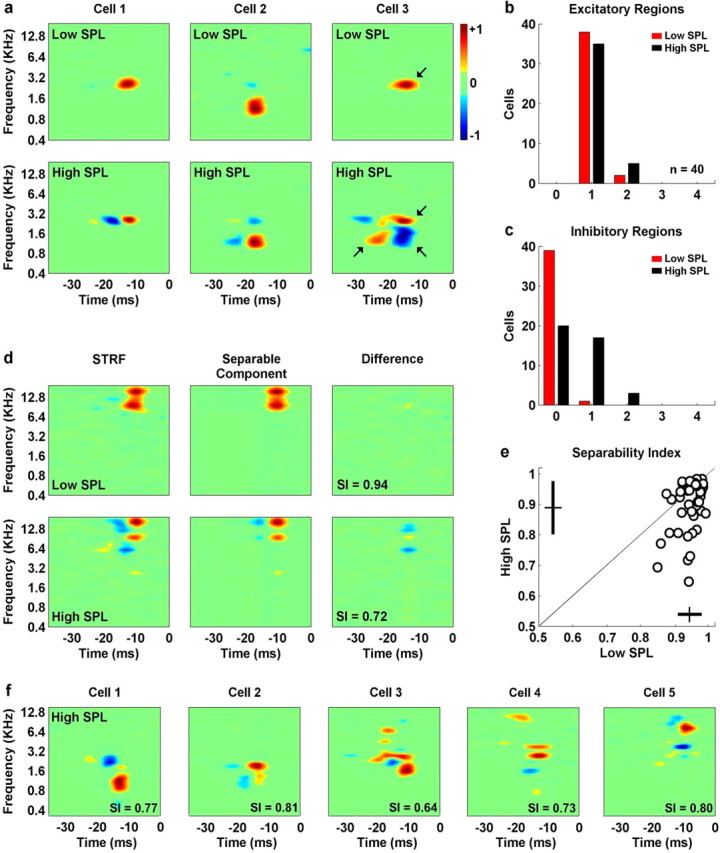
The STRFs of neurons in the inferior colliculus become more complex with increasing stimulus intensity. a, The STRFs for three cells measured from responses to the rain stimulus at two intensities (cell 1, 92 dB and 37 dB; cell 2, 72 dB and 32 dB; cell 3, 92 dB and 37 dB). The arrows on the STRFs for the third cell denote those regions whose strength (for definition, see Results) was large enough to be included in the counts shown in b and c. b, c, Histograms showing the number of excitatory and inhibitory regions in the low- (red) and high-intensity (black) STRFs for a population of 40 IC neurons. d, The high- and low-intensity STRFs for a typical neuron (97 and 72 dB), along with the separable component (the product of the functions of time and frequency corresponding to the largest singular value of the STRF) and the difference between the STRF and the separable component. The same color axes are used for the STRF, separable component, and difference plots. The separability index (the ratio of the largest singular value to the sum of all singular values) for each STRF is indicated. e, The separability indices of the high- and low-intensity STRFs for a population of 40 IC neurons. f, Five examples of high-intensity STRFs with low separability indices (cell 1, 92 dB; cell 2, 82 dB; cell 3, 92 dB; cell 4, 92 dB; cell 5, 92 dB).