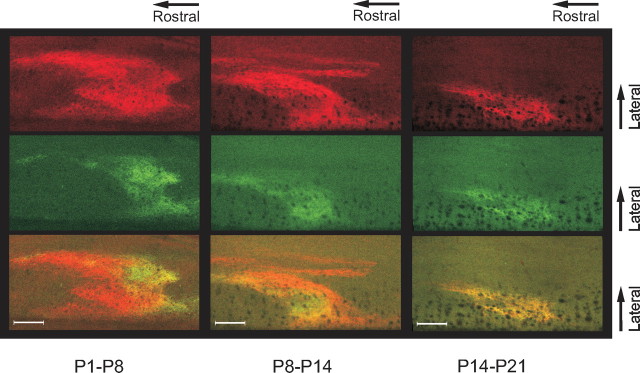
Figure 3.
Changes in individual terminal field morphology during the first 2 weeks. Three animals of different age received consecutive digit 4 labeling at different time points. Left, A P8 animal injected with red CTb at P1 and green CTb at P5. Middle, A P14 animal injected at P8/P11. Right, A P21 animal injected at P14/P18. Note the large nonoverlapping areas in the P8 and to some extent the P14 animal, but almost complete overlap at P21. Scale bars, 100 μm.

