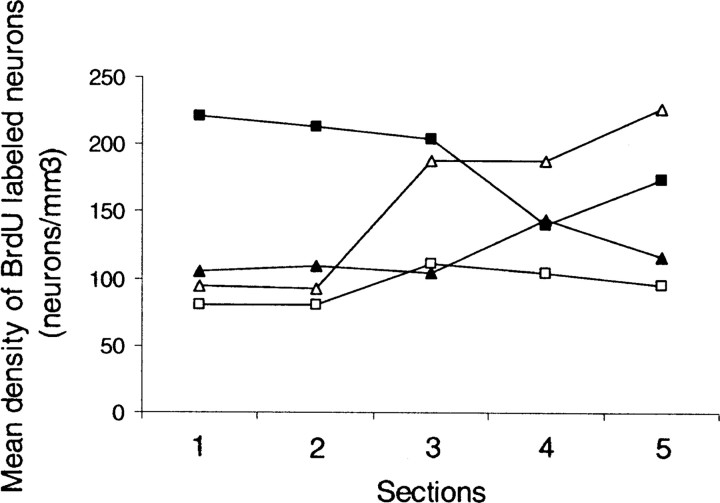
Figure 5.
Mean density (neurons per cubic millimeter) of BrdU+ neurons in five sections in the NC, in brains of males that were exposed to different social environments: ▵, C1M; □, S1M; ▴, C3M; ■, S3M. This figure is derived from Figure 3 to demonstrate the interaction between position along the NC rostrocaudal axis (section number) and social setting (for details, see Results). Lines are drawn for descriptive purposes only. The sample size in each group was, respectively, 7, 6, 7, and 6.

