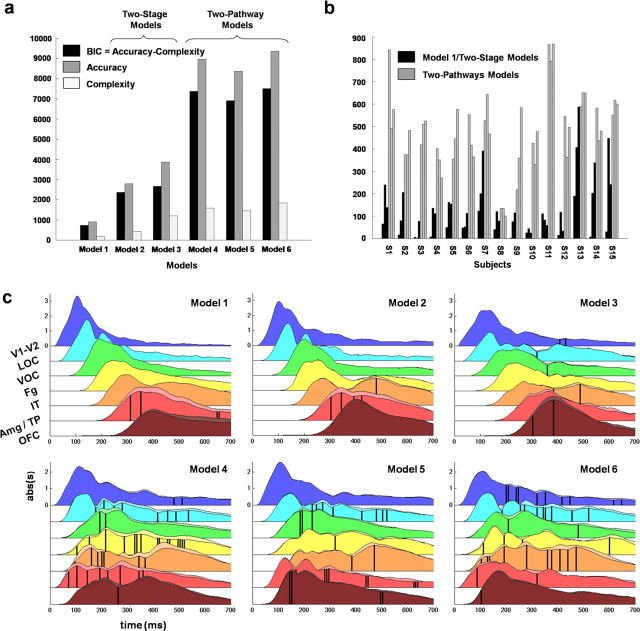
Figure 4.
Dynamic causal modeling results. a, Log evidence (BIC) of the different models (log evidence of the null model subtracted). Left, Group level. The log evidence is significantly different between two-stage and two-pathway models according to Bayesian inference (Penny et al., 2004). Right, Individual level. For 13 of the 15 subjects, the two-pathway models have better log evidence than the other models. b, Time courses of the average (n = 15) absolute values of the evoked dynamics estimated at the level of the populations of pyramidal neurons, for each region of interest and model. c, Region color codes correspond to the color codes in Figure 2, b and c. The main traces (underlined by darker surfaces) correspond to the neutral condition. The secondary traces (underlined by lighter surfaces) correspond to the maximum average response to either pleasant or unpleasant stimuli. Black vertical bars indicate significant effects of modulation by emotional competence (p < 0.05 uncorrected) (see Materials and Methods).

