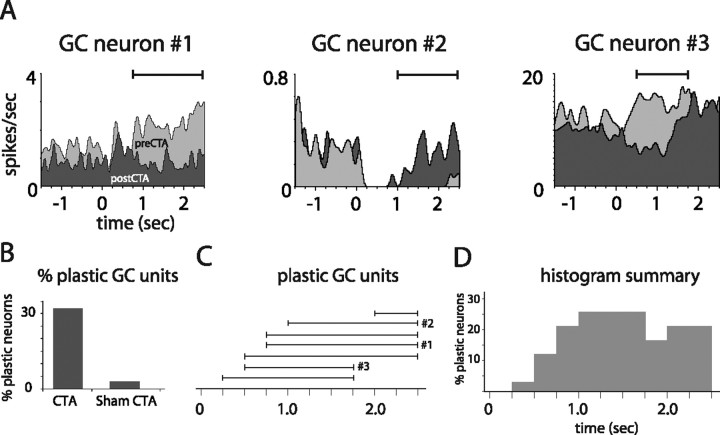
Figure 4.
CTA-related plasticity in single GC neurons held across learning. A, PSTHs of three representative GC units recorded from CTA rats, each held through training and testing sessions. Each example contains overlain saccharin PSTHs from before (light gray) and after (dark gray) learning. Solid horizontal lines above the PSTHs delineate periods of significant learning-related changes. B, The overall percentage of GC neurons for which saccharin responses changed, for rats that received CTAs and control rats. C, The time bins during which CTA changed saccharin responses (i.e., as for the solid horizontal lines in A), for each plastic GC neuron. The x-axis shows poststimulus time in 250 ms bins. The results for the neurons shown in A are marked. D, A summary of these data, showing the total percentage of held GC units with modified firing at each time point.

