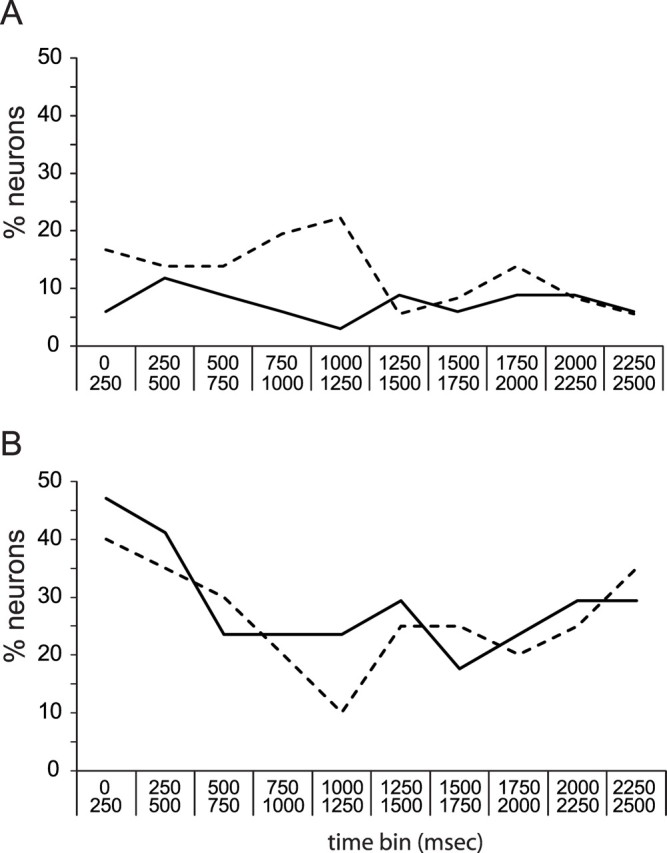
Figure 6.

The likelihood of BLA saccharin responses in training and testing sessions, examined separately. A, The x-axis shows time (in 250 ms bins), and the y-axis shows the percentage of BLA neurons showing significant responses to saccharin in ensembles recorded during training sessions (solid line) and ensembles recorded during testing sessions (dashed line) in CTA rats. No significant differences in the number of BLA neurons that responded to saccharin were visible. B, Similar analysis for control rats.
