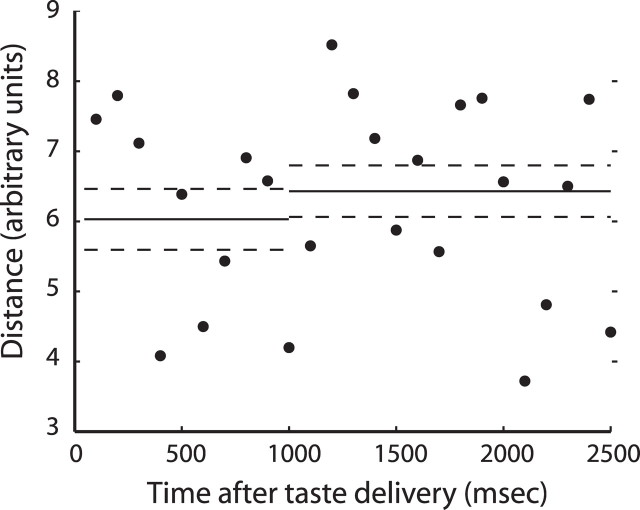
Figure 8.
CTA-related changes in BLA population coding of taste for neurons held across learning. Euclidean distances between matching time points in the PCA analysis, computed on the unsmoothed, unreduced data. The y-axis shows the Euclidean distance between matching time points in the PCA analysis computed on the unsmoothed, unreduced data for successive 100 ms bins (x-axis); that is, these data show the difference between the prelearning and postlearning BLA population codes for saccharin, at every point in stimulus-processing time. Conventions are as for Figure 5.

