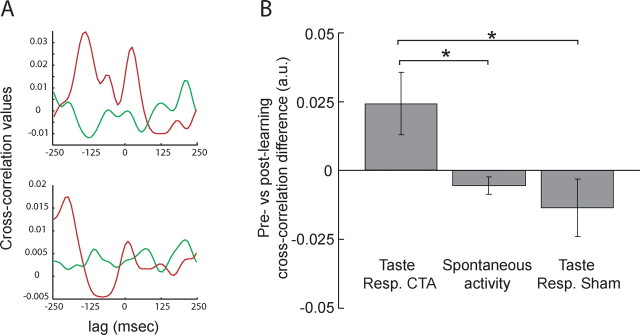
Figure 9.
CTA enhances functional connectivity between BLA and GC. A, Prelearning (green) and postlearning (red) cross-correlations (y-axis, correlation value; x-axis, lag) for two representative GC–BLA neuron pairs. For each pair, the prelearning cross-correlation is relatively flat, and the postlearning cross-correlation peaks are much higher. B, Average differences in prelearning and postlearning cross-correlation peaks (y-axis) changed during taste sampling, but not during spontaneous activity, and not for rats receiving “sham” training. Error bars represent SEM. *p < 0.05.

