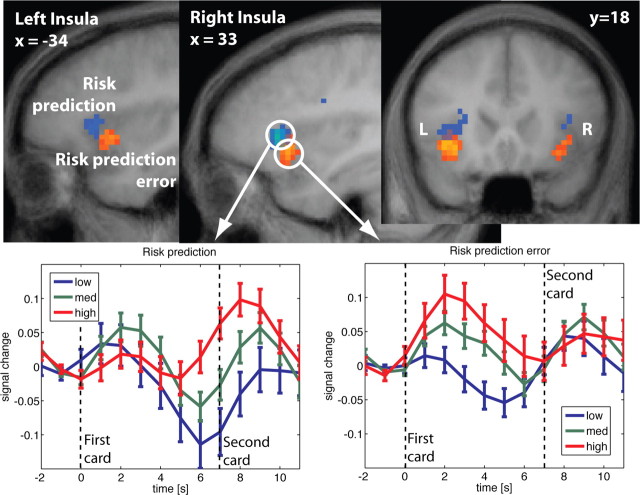
Figure 4.
Top, Activation in bilateral insula correlates with both risk prediction (blue) and risk prediction error (red). Risk prediction is reflected in an area slightly more superior and anterior than risk prediction error. Note, that both the red and blue clusters reflect positive correlations (random effects, df = 18; p < 0.0005). Different colors were chosen for better visualization. Bottom, Adjusted time courses in right insula at the first card. Before the first card, risk prediction is constant across all trials (Fig. 1). The risk prediction error at the first card is a function of the subject's bet and the first card. It is reflected in the time course immediately after the first card is shown (bottom right panel). Preceding the second card, a second estimate of risk prediction arises, which is reflected in the time course after the first card but only after a short delay (bottom left panel).

