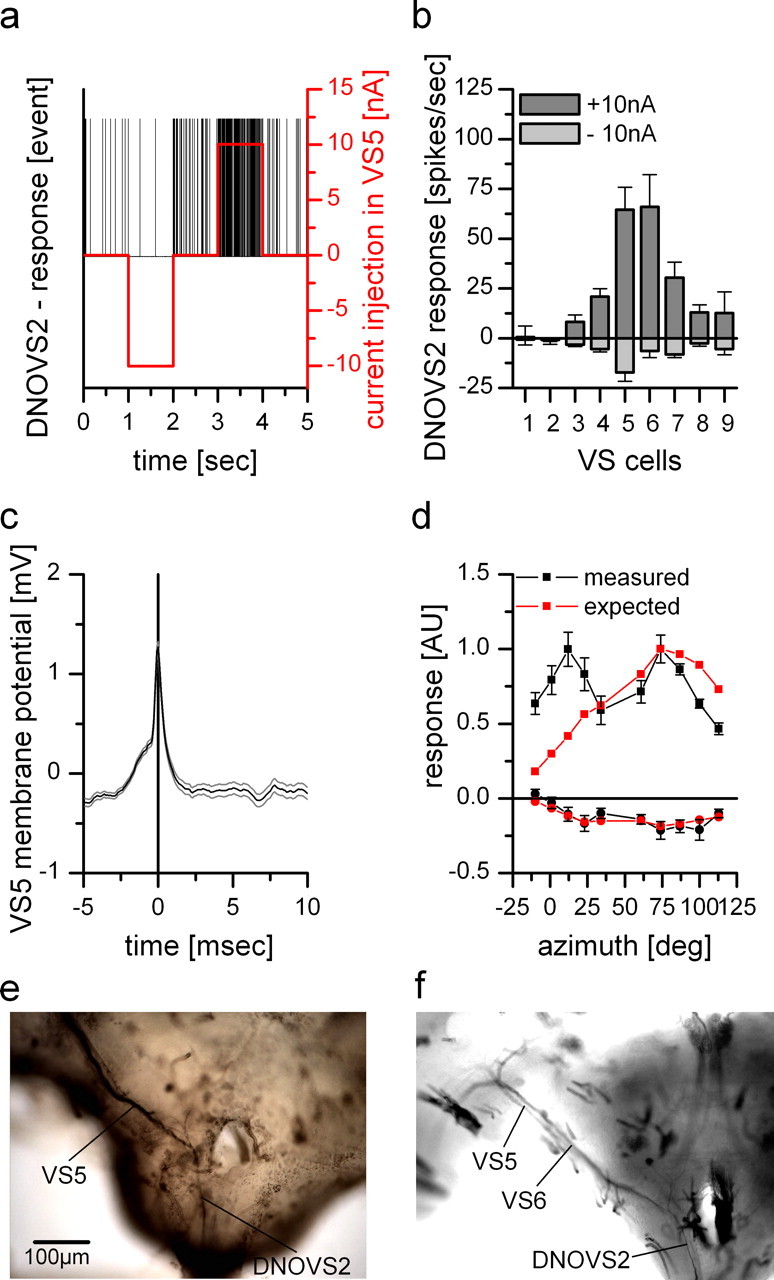
Figure 6.

Dual recordings and dye coupling between DNOVS2 and VS cells. a, Current injection of −10 and +10 nA into VS5 led to a decrease and an increase of the spike frequency of DNOVS2, respectively. b, Current injection of −10 nA (light gray columns) and +10 nA (dark gray columns) in different VS cells elicited different levels of spike frequency decrease and increase of DNOVS2, respectively. Whereas DNOVS2 showed no responses to current injection into VS1 and VS2, it responds when current was injected into VS3–VS9. The strongest response was found for current injection into VS5 and VS6. Data represent the mean ± SEM of VS1 (n = 2), VS2 (n = 4), VS3 (n = 4), VS4 (n = 3), VS5 (n = 5), VS6 (n = 3), VS7 (n = 4), VS8 (n = 4), and VS9 (n = 2). c, Spike-triggered average of the membrane potential of a VS5 cell. A spike elicited in DNOVS2 (time point = 0) leads to a slight depolarization of the membrane potential of VS5. This spike-induced membrane shift indicates an electrical coupling between VS5 and DNOVS2. Data represent the mean ± SEM of a double recording with n = 1000 detected spike repetitions. d, Expected response of DNOVS2 (red) to vertical motion as a function of the azimuth calculated by the average response of VS1–VS9 to this stimulation (data from Haag et al., 2007) weighted by their connection strength to DNOVS2 as determined by current injection in b. The measured (black) and expected (red) response of DNOVS2 differ in the frontal field of view, in which the expected response does not show the frontal peak to downward motion. Data for the measured response are the same as in Figure 1. AU, Arbitrary units. e, Neurobiotin staining of VS5. Besides the costaining of adjacent VS cells, DNOVS2 (or DNOVS3) was found to be labeled, too (data from Haag and Borst, 2005). f, Injection of Neurobiotin into DNOVS2 led to a retrograde staining of VS6 and a weaker stained VS5 cell.
