Figure 3.
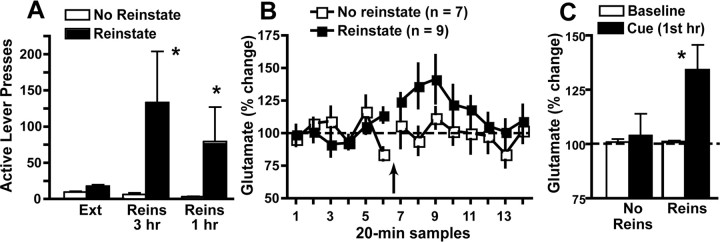
Extracellular glutamate in the NAcore is increased during cue-induced reinstatement (3 h test). A, Reinstatement of heroin seeking in animals during microdialysis shown in B. Animals were divided into two groups, those in which cues induced >15 lever presses over the 3 h reinstatement session (reinstate group), and those emitting <15 lever presses (no reinstate group). The third pair of bars indicates the number of active lever presses during the first hour of reinstatement. B, Extracellular glutamate in the NAcore before and during a cue-induced reinstatement session. C, For statistical comparison, the data from A were averaged over the baseline and during the first hour after beginning cue presentation. Thus, the bars in C indicate the means for the baseline and the first hour of the reinstatement session. A two-way ANOVA revealed that glutamate significantly increased above baseline in the reinstate group [time (F(1,14) = 5.174; p < 0.05), group (F(1,14) = 3.370; p < 0.09), interaction (F(1,14) = 3.631; p < 0.08)]. *p < 0.05 comparing first hour of glutamate release (C) or active lever presses (A) to baseline glutamate or extinction responding, respectively. Ext, Extinction; Reins, reinstatement.

