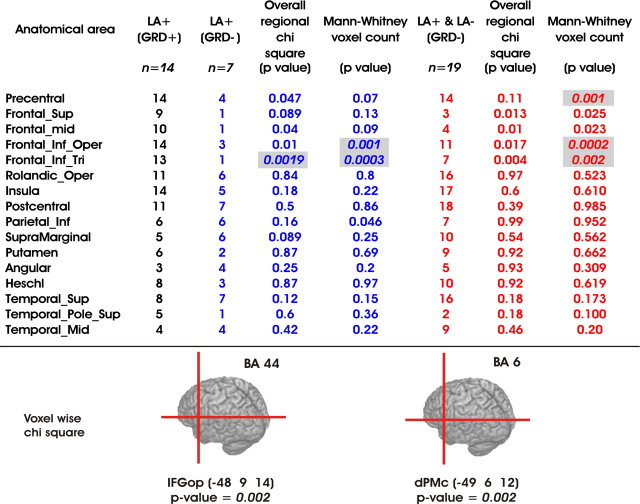
Table 1.
Statistical comparisons of the lesioned areas in LBD patients with apraxia and gestural comprehension deficits (LA+(GRD+)), with apraxia and no gestural comprehension deficits (LA+(GRD−)), and without gesture comprehension deficits independently from the presence of apraxia
Columns 2 (black), 3 (blue), and 6 (red) report the number of patients in each group with lesion in a specific AAL region (column 1). For each AAL, overall regional χ2 analyses (with Yates' correction) were performed using these values and reported in columns 4 and 7. The analysis on the number of damaged voxels for each AAL was assessed by means of Mann–Whitney U tests (columns 5 and 8). Significant comparisons are shown highlighted in gray. The Bonferroni correction for multiple comparisons was applied by taking into account the number of AAL regions. Therefore, the statistical threshold for significance was set at p < 0.0031. The bottom panel shows Talairach coordinates of the lesioned voxels significantly associated with gesture recognition deficits: x = −48, y = 9, and z = 14 for the pars opercularis, corresponding to Brodmann's area 44 in the left inferior frontal gyrus (IFGop); x = −49, y = 6, and z = 12 for the premotor cortex, corresponding to Brodmann's area 6 in the dPMc.

