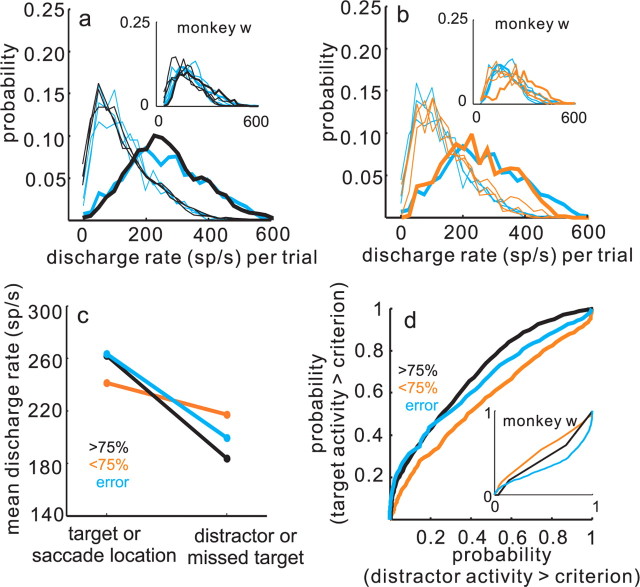
Figure 12.
SC buildup activity predicts the confidence of the decision. a, The probability of measuring a particular discharge rate in target and distractor neurons in error trials and >75% correct trials are superimposed. The black lines show data from the correct trials when performance was >75% accurate and the cyan lines show the data from the error trials. The thick lines are from target neurons (or neurons representing the stimulus chosen by the monkeys in the case of error trials), and the thin lines represent the distractors (or the missed targets in the case of error trials). Note that the black lines are the same data as plotted in Figure 5b. The insets show the data for monkey w as in the other figures. b, The probability of measuring a particular discharge rate in target and distractor neurons in error trials and <75% correct trials are superimposed. The cyan lines are the same as shown in a. The orange lines show the data for the <75% accurate trials. Thin orange lines are from distractor neurons and thick orange line is from target neurons. Note that the orange lines are the same data as shown in Figure 5c. The inset shows data from monkey w. c, The mean discharge rate taken from the distribution shown in a and b is plotted. The color scheme is the same as in a. Cyan points are from error trials and orange points are from <75% correct trials and black points are from >75% correct trials. d, ROC curves plotted for >75% accurate trials (black), <75% accurate trials (orange) and error trials (cyan). The inset shows data from monkey w.

