Figure 3.

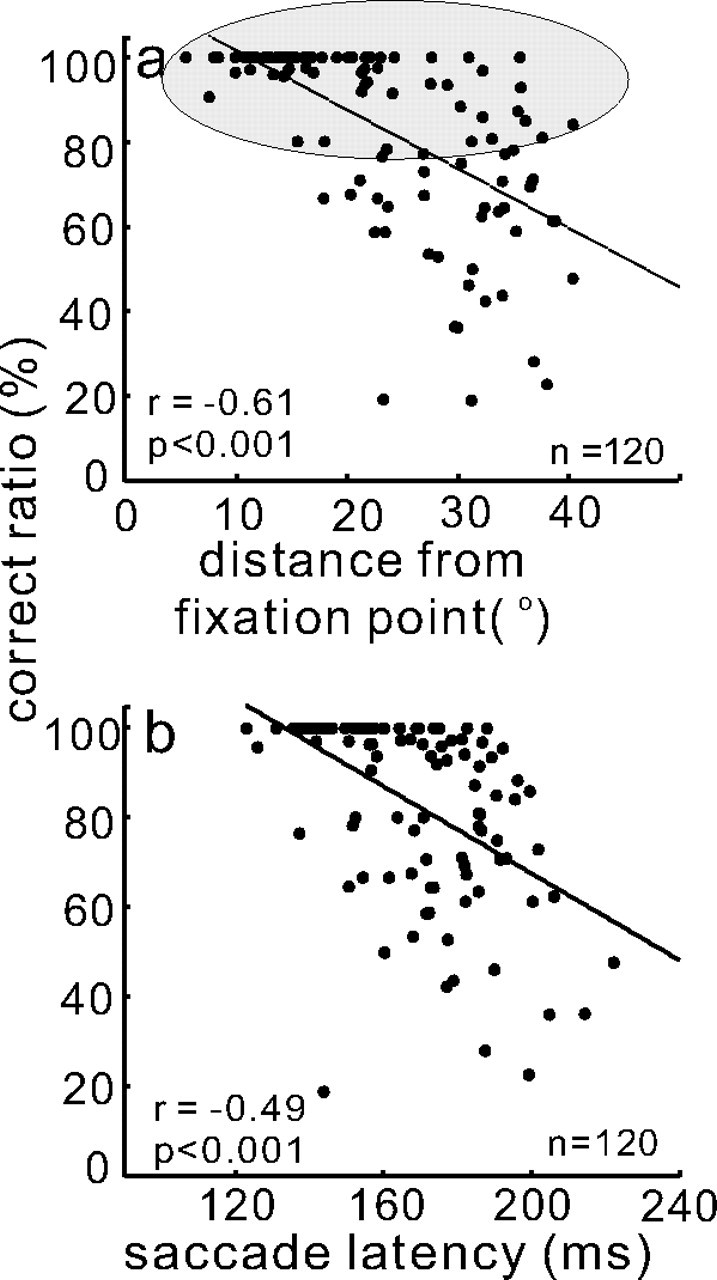
Saccade choices vary with target locations in the selection task. a, The ratio of correct to total trials expressed as a percentage is plotted against the amplitude of the target position relative to the fixation point in degrees. The amplitude of the target position was computed as target distance (in degrees) = , where x was the horizontal position of the target and y was the vertical position of the target. The fixation point was located at Cartesian coordinate 0,0. Each dot shows the target position for each experimental session from two monkeys (monkey m and monkey c). Despite an overall correlation between performance accuracy and distance of the target from the fixation point, there was a broad range of amplitudes associated with ∼80% accuracy as indicated schematically by the gray ellipse. b, Ratio of correct to total trials (percentage) is plotted against saccade latency. As the percentage of correct choices increased, saccade latency decreased. The solid black line is the best fit linear regression. Each dot is from one neuron when it had the target in its RF. The total number of neurons (n) was 120 (30 sets of 4 from two monkeys). r is the Pearson r value.
