
Figure 5.
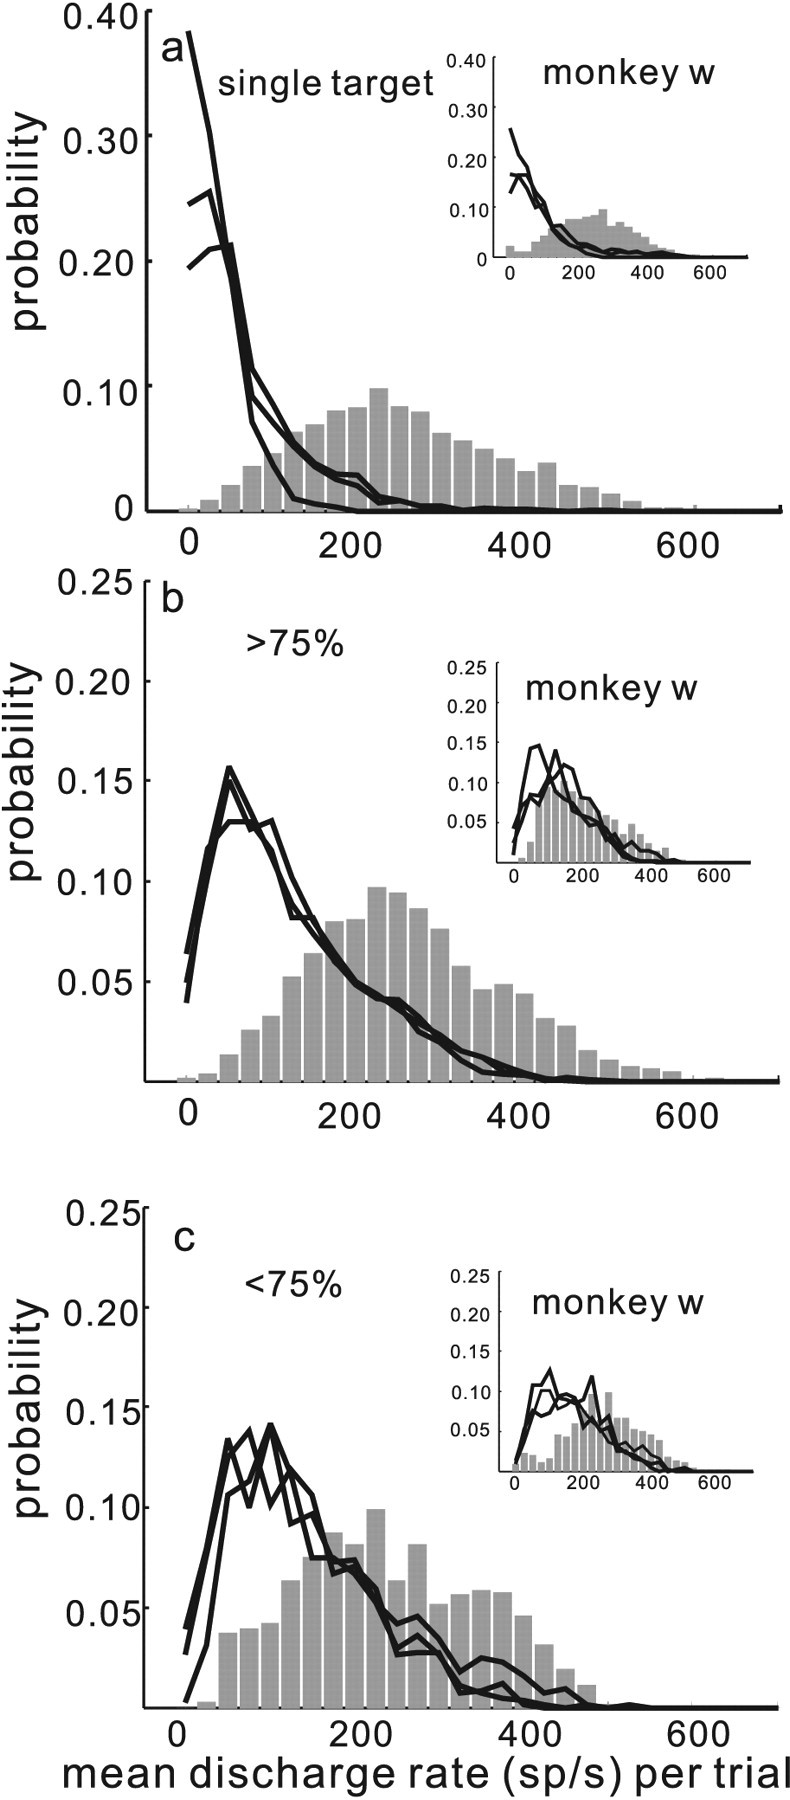
The separability of discharge rates between target and distractor neurons varies. The probability of measuring a particular discharge rate in target and distractor neurons is plotted from all of the data from all three monkeys. The data come from a total of 176 neurons and 4590 correct trials. The insets show the data for monkey w. a, Probability is plotted against the mean discharge rate measured 100 ms before saccade onset from the data collected in the single target condition. The same interval, using the saccade latency to the target, was used to calculate the distractor neuron activity. The black lines show the probability distribution of discharge rates for each of the three distractor neurons in the single target condition. The gray bars show the probability distribution for the discharge rates measured from target neurons in the single target condition. b, Probability is plotted against mean discharge rate measured on trials in which monkeys performed the four stimuli task with >75% accuracy. The arrangement is the same as in a. c shows the same as b, but for trials in which monkeys performed with <75% accuracy.