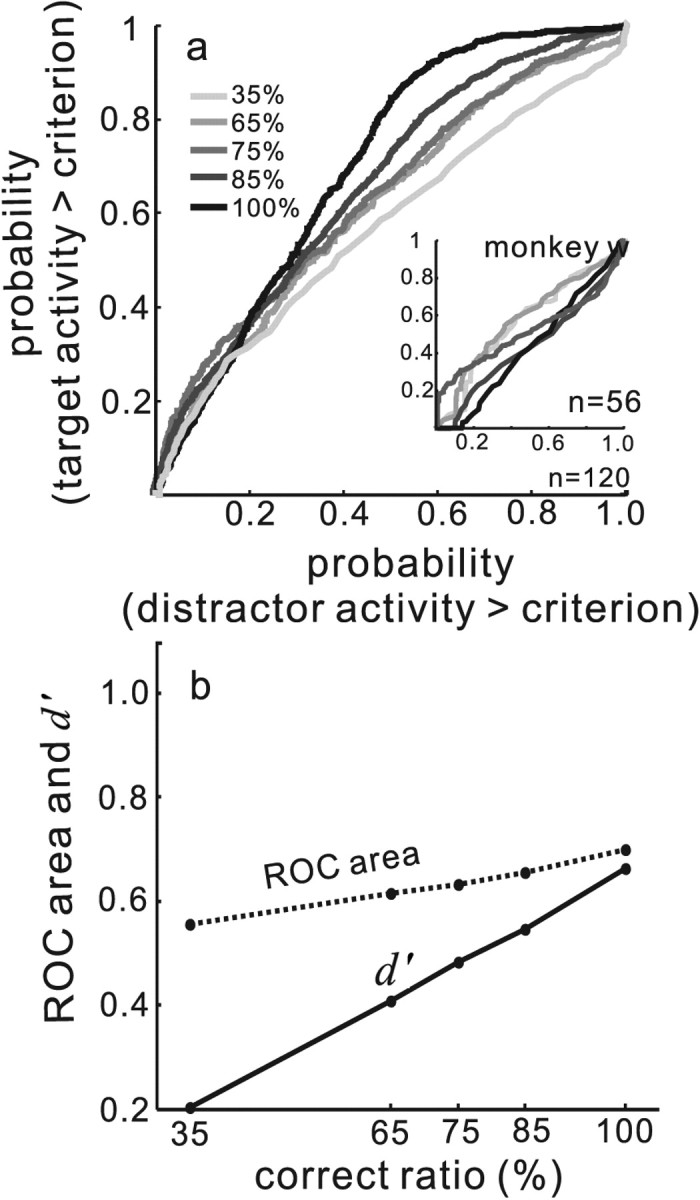
Figure 7.

Separation and discriminability of target and distractor neuronal activity scale with performance accuracy. a, The entire data set for the two monkeys was sorted by performance. The inset shows the entire data set for monkey w. All trials across all neurons were sorted into subsets of 35, 65, 75, 85, and 100% correct trials. ROC curves were computed from the discharge rates of target and distractor neurons as described in Materials and Methods. ROC curves are plotted for the different performance levels and shades of gray indicate performance level. Light gray indicates poorest performance (35% of trials performed correctly), and the black line indicates best performance (100% of trials performed correctly; see the inset legend). n indicates the number of neurons contributing to the plot. b. ROC area (dashed line) and d′ (solid line) are plotted on the ordinate. The abscissa shows the ratio of correct to total trials expressed as a percentage. Each point connected by a line is one ROC area or d′ obtained for each level of performance accuracy.
