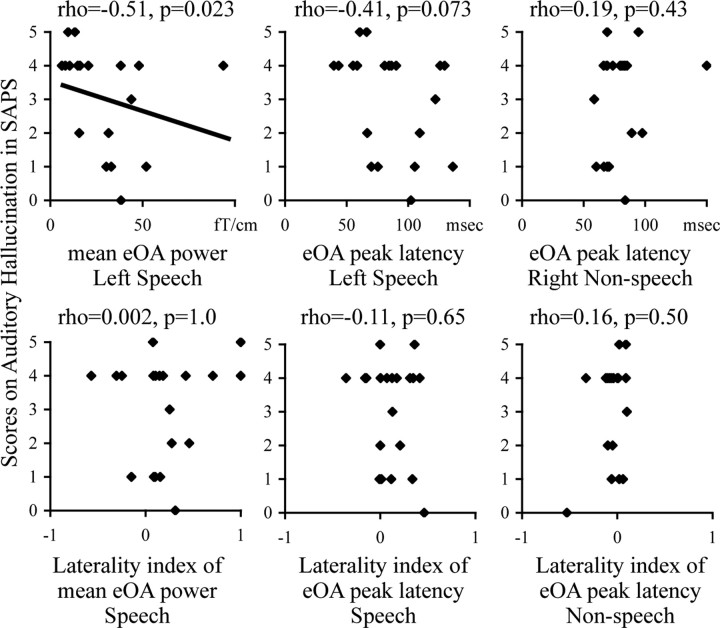
Figure 3.
Scattergrams between the mean eOA powers to speech sounds in the left hemisphere in the 100–150 ms period, the eOA power peak latency to speech sounds in the left hemisphere, the eOA power peak latency to nonspeech sounds in the right hemisphere and the LI of these indices, and the scores of auditory hallucinations.

