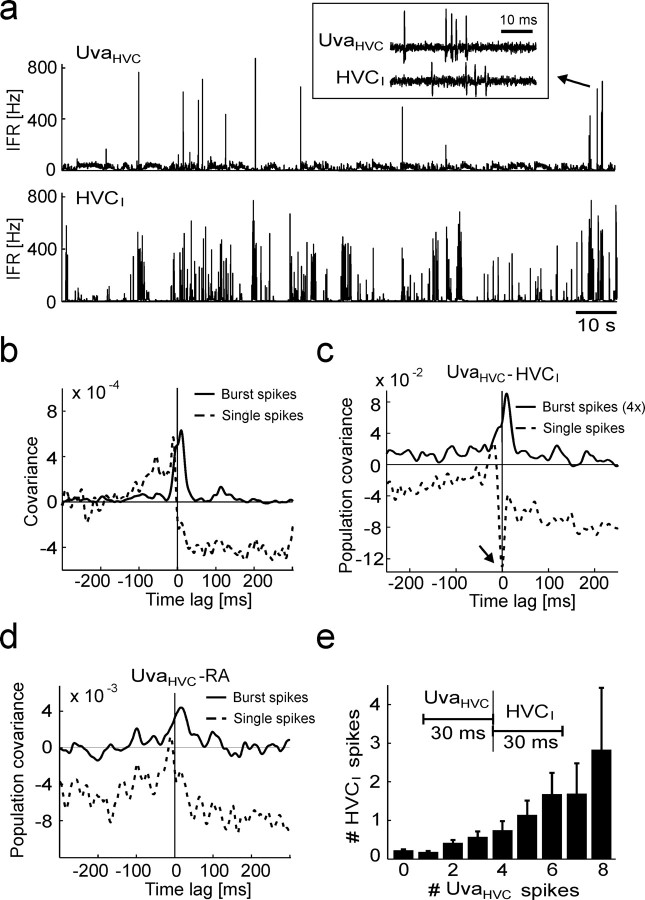
Figure 3.
UvaHVC bursts correlate with RA and HVCI bursts during sleep. a, IFR plots of a simultaneously recorded UvaHVC–HVCI pair (no clipping of UvaHVC firing rates). Inset, The raw signals of an UvaHVC burst (arrow) followed by an HVCI burst. b, The covariance functions of the same neuron pair for UvaHVC single spikes (dashed line) and UvaHVC burst spikes (solid line): UvaHVC bursts tend to precede HVCI spikes. c, The population UvaHVC–HVCI covariance function for UvaHVC single spikes (dashed line) has a negative dip at 0 ms (arrow), and for UvaHVC burst spikes (solid line) it has a peak at 10 ms (n = 7 neuron pairs). For better visibility, the burst-related covariance function has been stretched by a factor of four in the vertical direction (labeled “4×”). d, The population UvaHVC–RA covariance functions for RA burst spikes and UvaHVC single spikes (dashed line) and for burst spikes in both RA and UvaHVC neurons (solid line; the peak at 16 ms is weakly significant; p = 0.05; n = 9 neuron pairs). Note that the population covariance functions in c and d are based on concatenating all simultaneously recorded spike trains, because averaging over individual covariance functions as in Figure 2c did not work well (some UvaHVC cells did not produce enough burst spikes). e, Bar plot of the average number of HVCI spikes per 30 ms window as a function of the average number of (all) UvaHVC spikes fired in the preceding 30 ms windows. Error bars indicate SEM.

