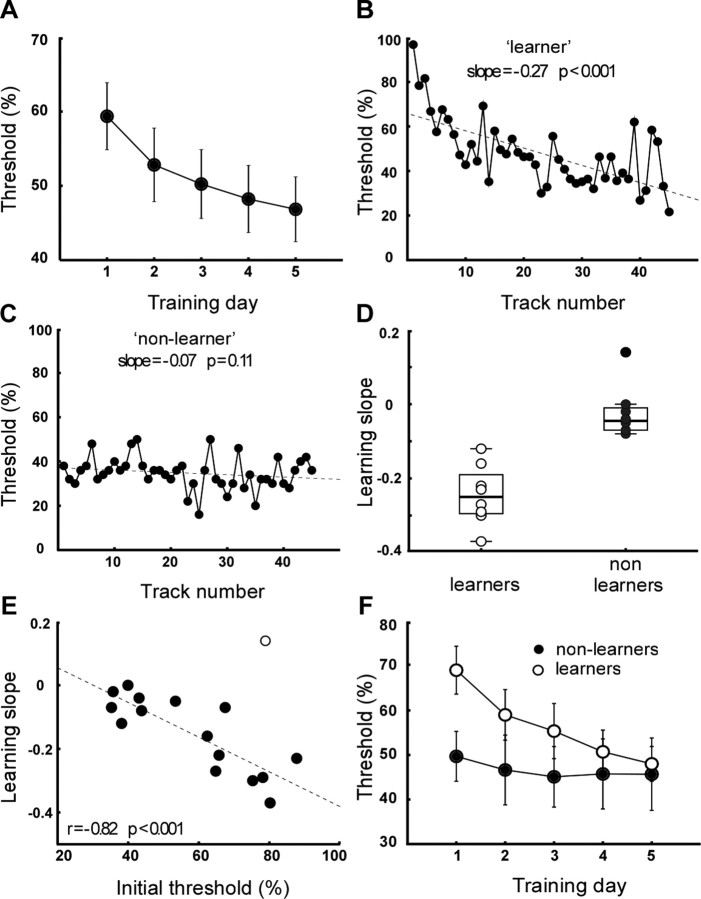
Figure 1.
Behavioral results. A, Average discrimination threshold as a function of training day. Error bars show SEM. B, C, Example learning curves of individual participants showing significant (learner) and nonsignificant (nonlearner) improvement. D, Distribution of learning slopes for learners and nonlearners. Box plot shows median and interquartile range. E, Initial discrimination threshold versus fitted learning slope. Open circle shows outlier not included in correlation analysis. F, Average discrimination threshold as a function of training day for learners (open circles) and nonlearners (filled circles).

