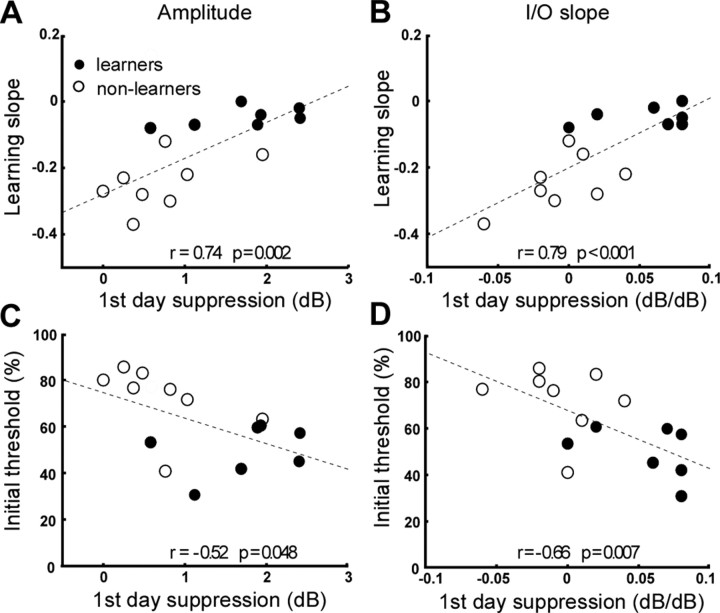
Figure 3.
Correlation between behavioral and physiological measures. All plots refer to suppression of CEOAEs on the first training day. Left column (A, C), Amplitude suppression at 30 dB SL. Right column (B, D), I/O suppression. Top row (A, B), Suppression versus learning slope. Bottom row (C, D), Suppression versus initial discrimination threshold. Open circles indicate individual values for learners and filled circles for nonlearners.

