
Figure 1.
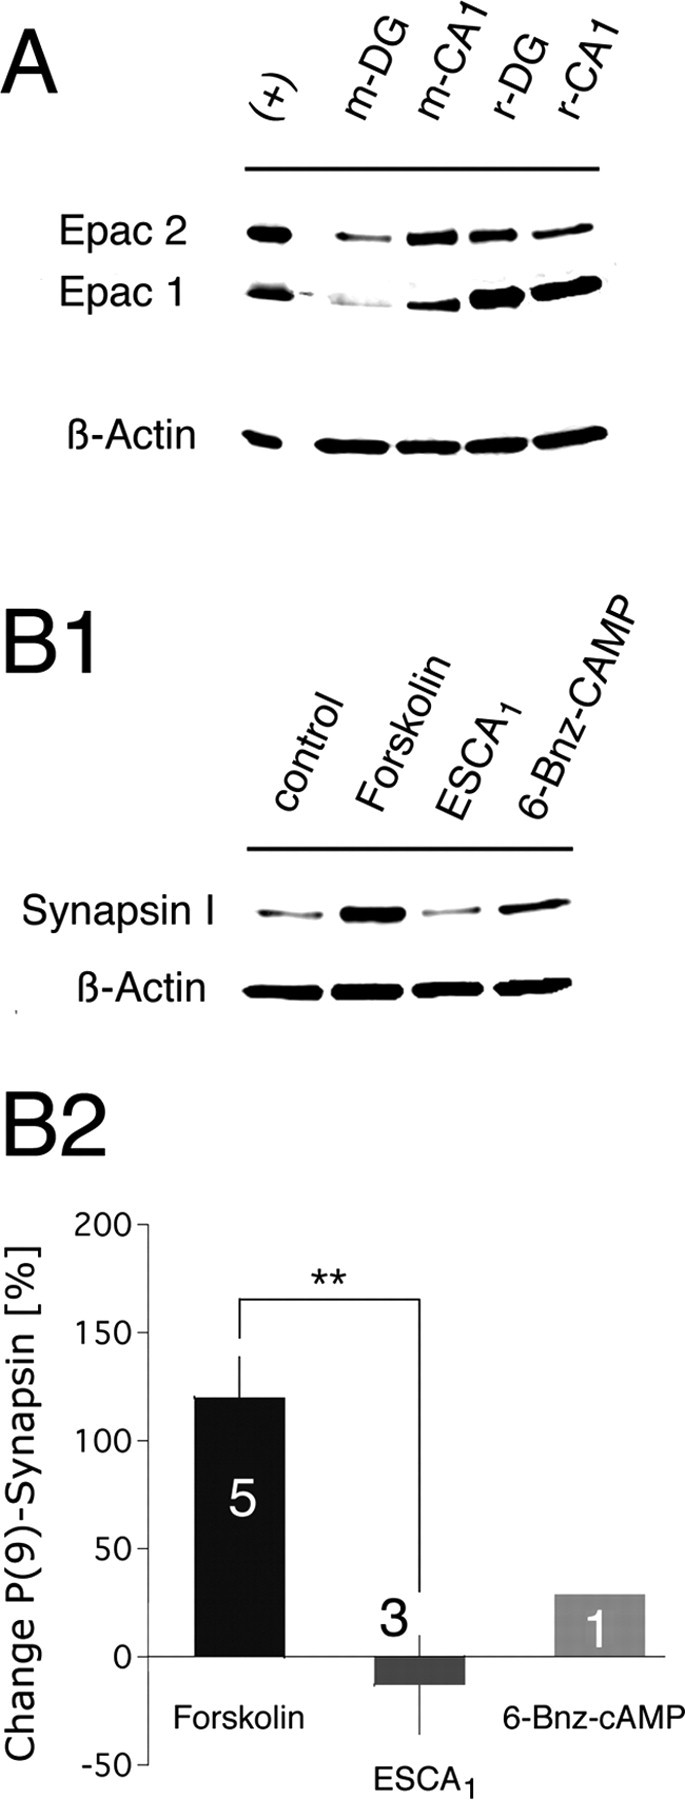
Expression of Epac in neuronal cell cultures. A, Cultured autaptic neurons express both Epac isoforms. Lanes, Rat cerebellum lysate, positive control (+), murine dentate gyrus neurons (m-DG), murine CA1 neurons (m-CA1), rat dentate gyrus neurons (r-DG), rat CA1 neurons (r-CA1). Protein bands were detected at the following molecular weights: 126 kDa for Epac2, 100 kDa for Epac1, and 43 kDa for β-actin. Epac1 experiments were performed in triplicate. B1, Test for the specificity of the Epac-activating cAMP analog, ESCA1. A Western blot analysis of cAMP- or cAMP-analog-mediated phosphorylation of synapsin I at its PKA phosphorylation site (Ser9) is shown. For drug treatment procedure, see Materials and Methods. β-Actin controls for equal protein loading. B2, Quantitative change in the phosphorylation level of the PKA site of synapsin I. To correct for nonspecific effects (unrelated to drug treatment), which might have been introduced by variability in protein loading, P-Ser9 synapsin I chemiluminescence intensities were first normalized to the intensities of the corresponding β-actin values. These values were further normalized to the control intensity value to determine the increase or decrease in P-Ser9 levels after drug treatment. Values are shown as mean ± SEM based on the number of different Western blot performances. Statistical significance was tested by an unpaired two-tailed Student's t test assuming unequal variances (see Materials and Methods). Numbers within histogram bars represent the number of measurements.