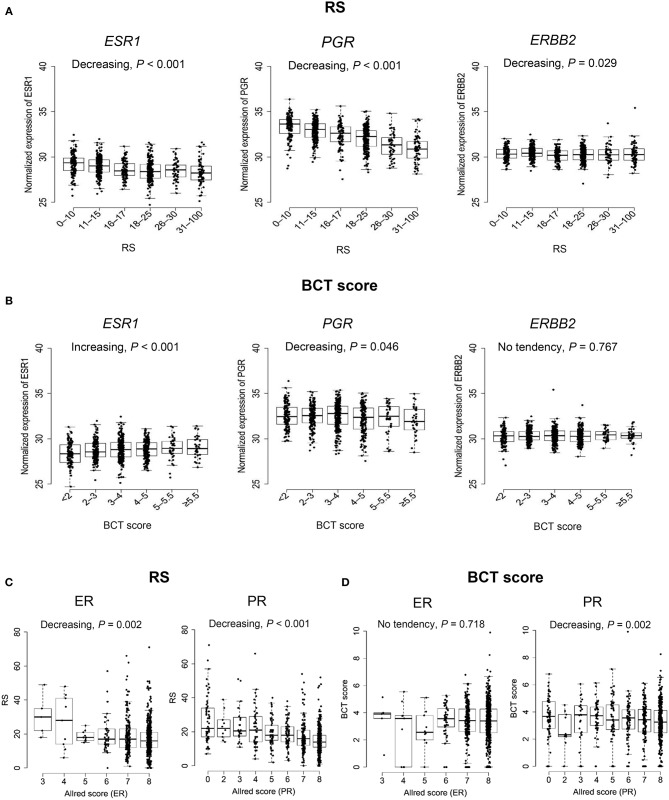
Figure 5.
Association between ER, PR, and HER2 expression and the BCT score or Oncotype DX RS. (A) Association of ESR1, PGR, and ERBB2 gene expression with the RS and (B) the BCT score. (C) Correlation of ER and PR expression by Allred score with the RS and (D) the BCT score. The P-value of the trend was determined using the Jonckheere-Terpstra test (one-sided). The expression of ESR1, PGR, and ERBB2 was measured by qRT-PCR. ER and PR Allred score were determined using immunohistochemistry.

