
Figure 1.
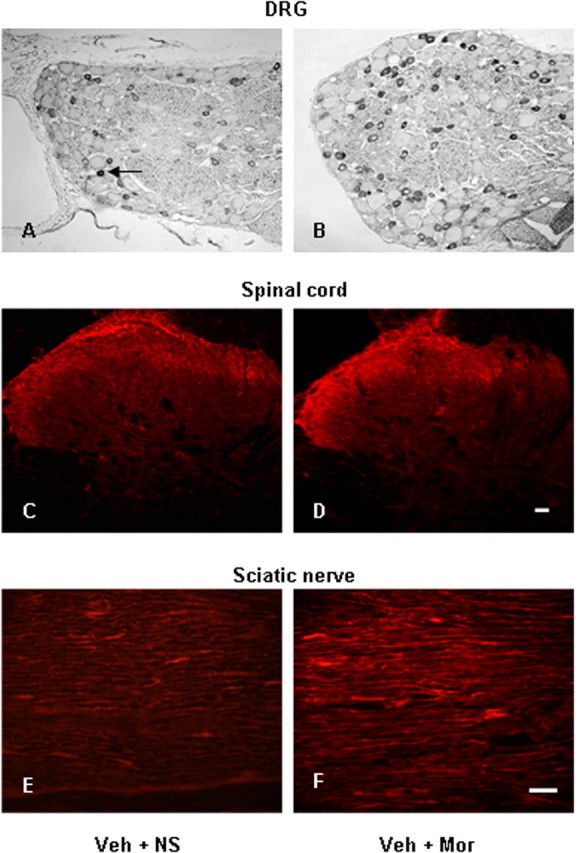
Photomicrographs of TRPV1-IR in DRG (A, B), spinal cord (C, D), and sciatic nerve (E, F) from control (A, C, E) and morphine (B, D, F) treated rats. A, Arrow indicates a TRPV1-IR DRG neuron. Scale bars: (in D) A–D, 20 μm; (in F) E, F, 40 μm. Veh, 25% DMSO; Mor, Morphine.