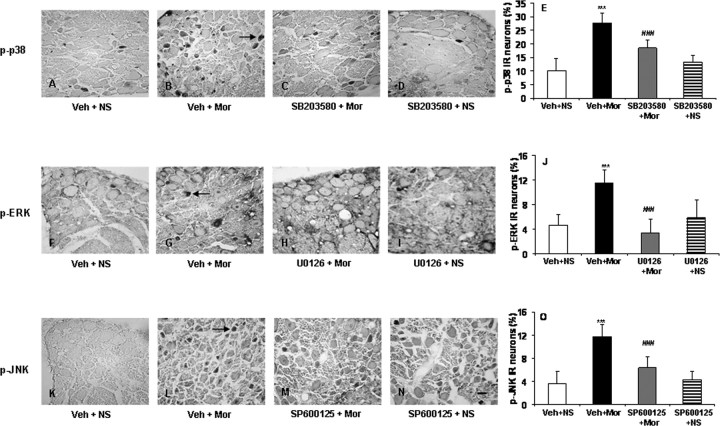
Figure 6.
Photomicrographs (A–D, F–I, K–N) and quantification (E, J, O) showing p-p38-IR (A–E), p-ERK-IR (F–J), and p-JNK-IR (K–O) in DRG neurons of the control, morphine, and the selective MAPK inhibitor pretreated control and morphine groups. Percentages of p-p38-, p-ERK-, and p-JNK-IR were increased after chronic morphine exposure (B, G, L and E, J, O; ***p < 0.001, Veh + Mor vs Veh + NS); this increase was reduced by treatment with the selective MAPK inhibitors (C, H, M and E, J, O; ###p < 0.001 for SB203580 + Mor, U0126 + Mor, or SP600125 + Mor vs Veh + Mor). No significant difference in the phosphorylation of MAPK was detected between control and the selective MAPK inhibitor pretreated control groups (SB203580 + NS, U0126 + NS, or SP600125 + NS vs Veh + NS). One-way ANOVA, followed by Tukey's test was used for statistical analysis. n = 6 for each group. Arrows in B, G, and L indicate p-p38-, p-ERK-, or p-JNK-IR DRG neurons. Scale bar (in N): A–D, F–I, K–N, 40 μm.

