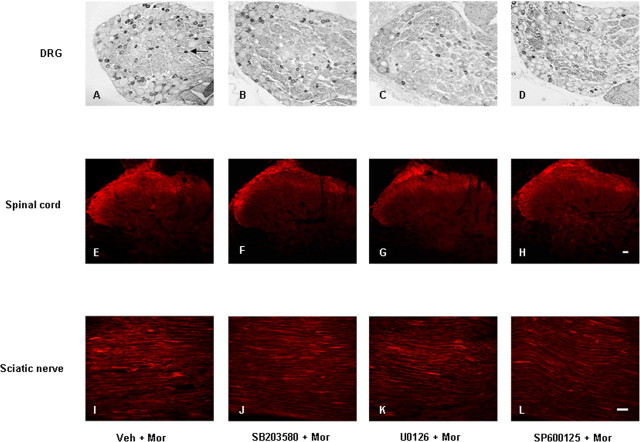
Figure 8.
Photomicrographs of TRPV1-IR in DRG (A–D), spinal cord (E–H), and sciatic nerve (I–L) from rats treated with morphine (A, E, I) and additional pretreatment with SB203580 (B, F, J), U0126 (C, G, K), or SP600125 (D, H, L). Arrow in A indicates a TRPV1-IR DRG neuron. Scale bars: (in H) A–H, 20 μm; (in L) I–L, 40 μm.

