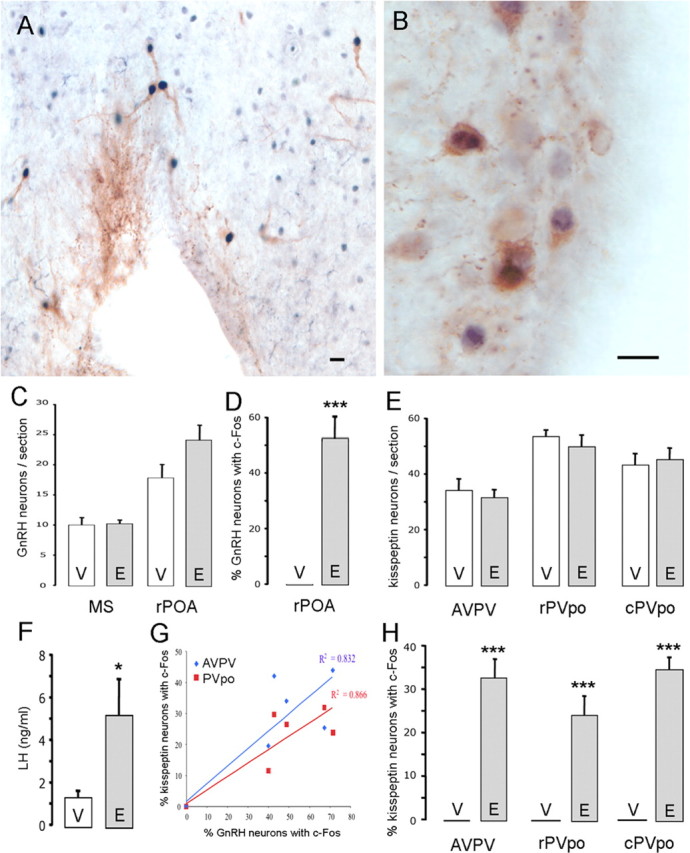
Figure 2.

RP3V kisspeptin neurons express c-FOS at the time of the GnRH/LH surge. A, Dual-label immunocytochemistry showing GnRH neurons (brown) with c-FOS-immunoreactive nuclei (black). B, Dual-label immunocytochemistry showing AVPV kisspeptin neurons (brown) with c-FOS immunoreactive nuclei (black). C, Bar graph showing the mean + SEM number of GnRH neurons counted per section in the MS and rPOA of OVX+E- (E) and OVX+V- (V) treated wild-type mice. D, Percentage of rPOA GnRH neurons expressing c-FOS in OVX+E- and OVX+V-treated wild-type mice. E, Bar graph showing the number of kisspeptin neurons counted per section in the AVPV, rPVpo, and cPVpo in OVX+E- and OVX+V-treated wild-type mice. F, Bar graph showing the LH levels in OVX+E- and OVX+V-treated wild-type mice. G, Graph showing the positive correlation between percentage of GnRH neurons with c-FOS and percentage of RP3V kisspeptin neurons with c-FOS in the AVPV and the PVpo combined. H, Percentage of kisspeptin neurons at the three levels of the RP3V expressing c-FOS in OVX+E- and OVX+V-treated wild-type mice. *p < 0.05, ***p < 0.001, V versus E. Scale bars, 10 μm.
