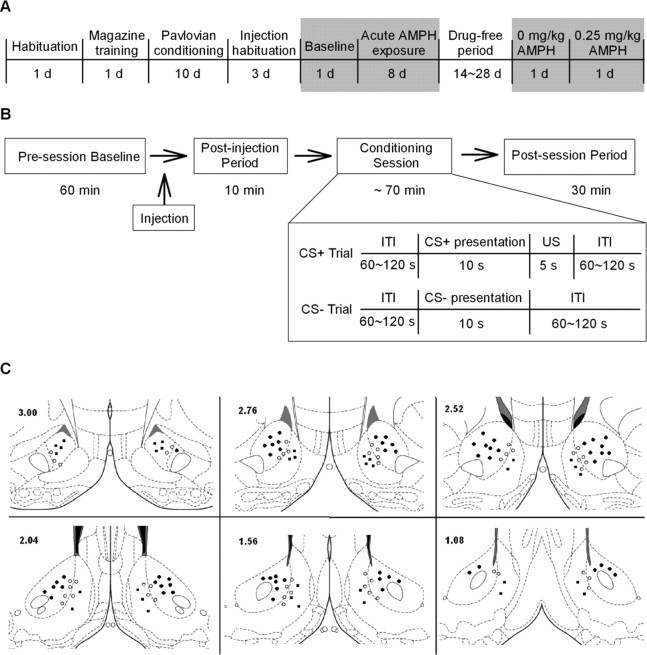
Figure 1.
Experimental schematics and placement of electrodes. A, Timeline of the experimental phases. Shaded areas represent the phases during which electrophysiological recordings were conducted. B, Timeline of a single recording session. The schematic in the inset shows the events during the training session. C, Location of recording sites. Marks on coronal diagrams display the location of electrode tips that were verified to be in the NAc and contributed to data analysis. Dark circles represent electrode tips in the NAc core, dark squares represent electrode tips in the NAc shell, and open circles represent electrode tips on the core–shell border. Numbers in the left corner indicate the anterior–posterior coordinates (in millimeters) rostral to bregma. Coordinates were taken from Paxinos and Watson (2005).

