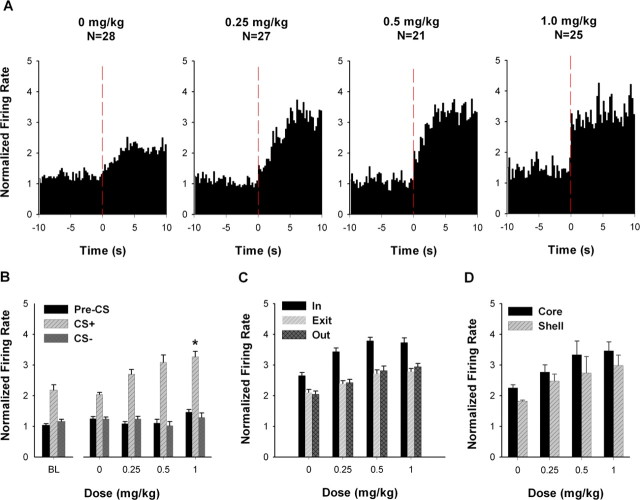
Figure 4.
Average excitatory CS+ responses during the acute AMPH phase. A, Population perievent histograms showing the average responses of neurons that exhibited an excitatory CS+ response. In each histogram, average normalized firing rate is plotted as a function of 0.25 s time bins for the 10 s pre-CS+ and CS+ periods. The vertical dashed line at time 0 represents the CS+ onset. B, For neurons exhibiting an excitatory CS+ response, average normalized firing rate is plotted as a function of AMPH dose for the pre-CS+, CS+, and CS− periods. The asterisk indicates a significant increase in firing at 1.0 mg/kg AMPH relative to 0 mg/kg AMPH (p < 0.05). BL, Baseline. C, For neurons exhibiting an excitatory CS+ response, the average normalized firing rate is plotted as a function of AMPH dose for the “in,” “exit,” and “out” periods. Detailed definitions of the in, exit, and out periods are given in Materials and Methods. D, For neurons recorded from the NAc core and shell, the average normalized firing rate during the CS+ period is plotted as a function of AMPH dose. Error bars represent SEM.

