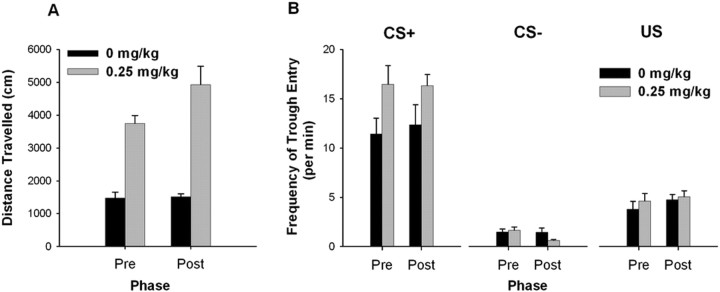
Figure 7.
Locomotor activity and the frequency of trough entry before and after the drug-free period. A, The locomotor activity score is plotted for both the 0 and the 0.25 mg/kg AMPH sessions before and after the drug-free period. B, The frequency of trough entry during the CS+, CS−, and US periods is plotted for the 0 and 0.25 mg/kg AMPH sessions both before and after the drug-free period. In all figures, “Pre” on the x-axis indicates sessions before the drug-free period, and “Post” indicates sessions after the drug-free period. Error bars represent SEM.

