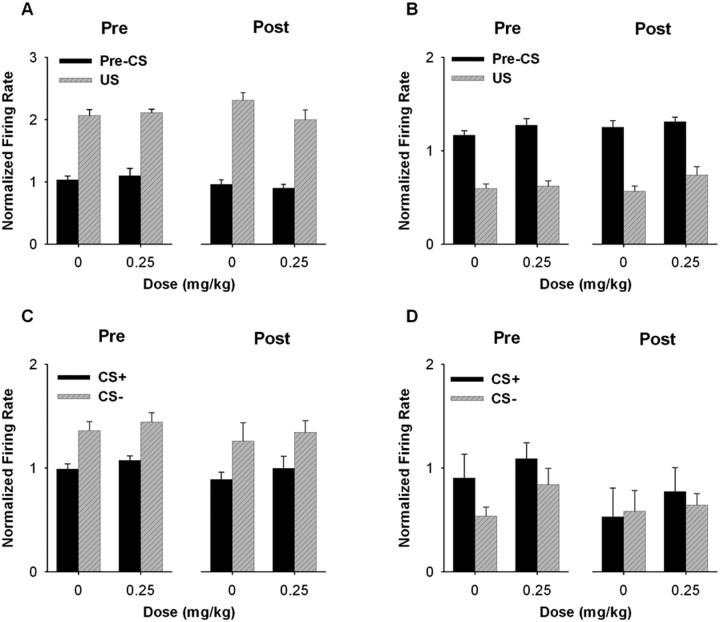
Figure 9.
Average US and CS− responses before and after the drug-free period. A, B, For neurons exhibiting responses to the US, average normalized firing rate during the pre-CS+ and the US periods is plotted for the 0 and 0.25 mg/kg AMPH sessions both before and after the drug-free period. A, Neurons excited during the US. B, Neurons inhibited during the US. C, D, For neurons exhibiting CS− responses, the average normalized firing rate during the CS+ and CS− periods is plotted for both the 0 and 0.25 mg/kg AMPH sessions both before and after the drug-free period. C, Neurons excited during the CS−. D, Neurons inhibited during the CS−. Error bars represent SEM.

