
Figure 7.
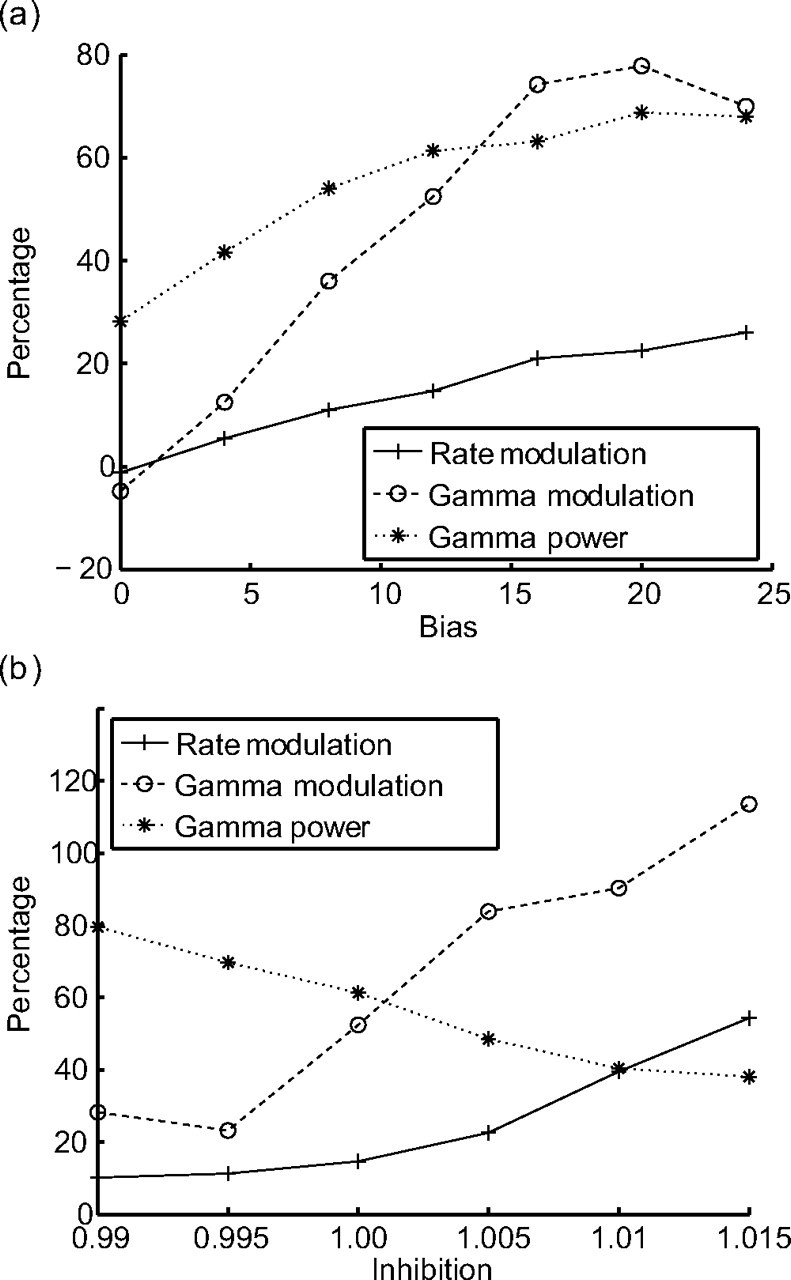
Dependences of attentional modulation on inhibition and bias. Gamma power (dotted curve) shows how much of the power of the spectrum is in the gamma band. Rate modulation (solid curve) and gamma modulation (dashed curve) show the difference between attended and unattended pools in percentage. Averaged over 200 trials. a, Gamma power, rate modulation, and gamma modulation as a function of bias. For increasing bias, synchronization, rate modulation, and gamma modulation increase. b, Gamma power, rate modulation, and gamma modulation as a function of inhibition. For increasing inhibition, synchronization decreases, whereas both rate modulation and gamma modulation increase.