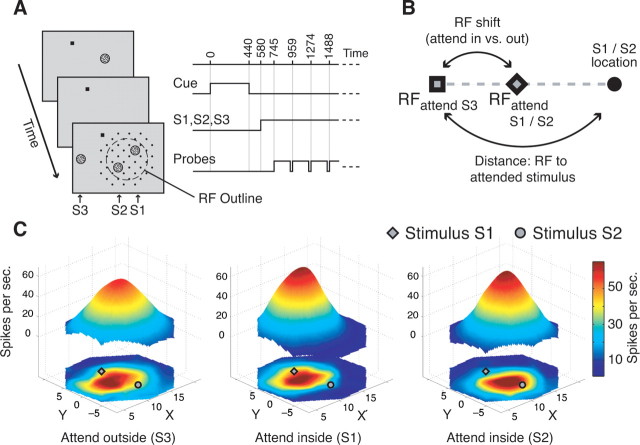
Figure 1.
Experimental protocol and illustration of receptive field maps. A, Experimental layout showing the succession of cue, target stimulus (S1, inside the receptive field outline; dashed circle), distractor stimuli (S2, inside receptive field; S3, outside receptive field), and the possible locations of the probe stimulus (black dots). B, Illustration of the calculation of receptive field shift (distance of the receptive fields in the attend outside and attend inside conditions) proportional to the distance of the receptive field (attend outside) to the attended stimulus position. C, Example receptive fields of a neuron while attention was directed outside the receptive field to S3 (left), inside the receptive field to stimulus S1 (middle), and to stimulus S2 (right). The bottom maps show spline-interpolated neuronal response profiles and the floating three-dimensional maps are the Gaussian fits used to describe the receptive field parameters. The example illustrates that responses to probes close to (far from) an attended stimulus in the receptive field were enhanced (reduced) compared with when attention was directed to S3.

