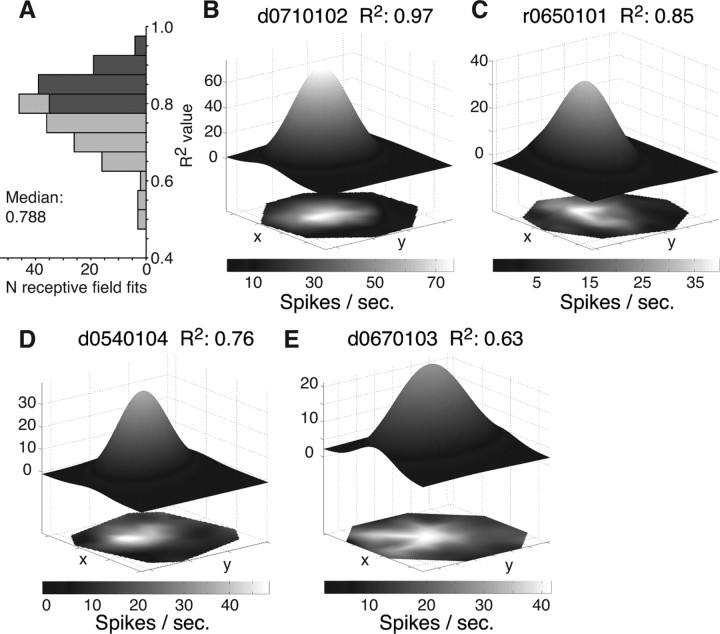
Figure 2.
Fitting MT receptive fields with a Gaussian profile. A, Distribution of R2 values of the Gaussian fits to individual receptive fields in the different attentional conditions. Bar coloring indicates fits with an above-median (dark gray) and below-median (light gray) R2 value. B–E, Examples of spline-interpolated (bottom, surfaces in two dimensions) and fitted (top, three-dimensional surfaces) receptive field profiles with an above-median R2 value (B, C) and a below-median R2 value (D, E).

